


Revista principals share data on sales, construction, leasing and more
By John B. Mugford
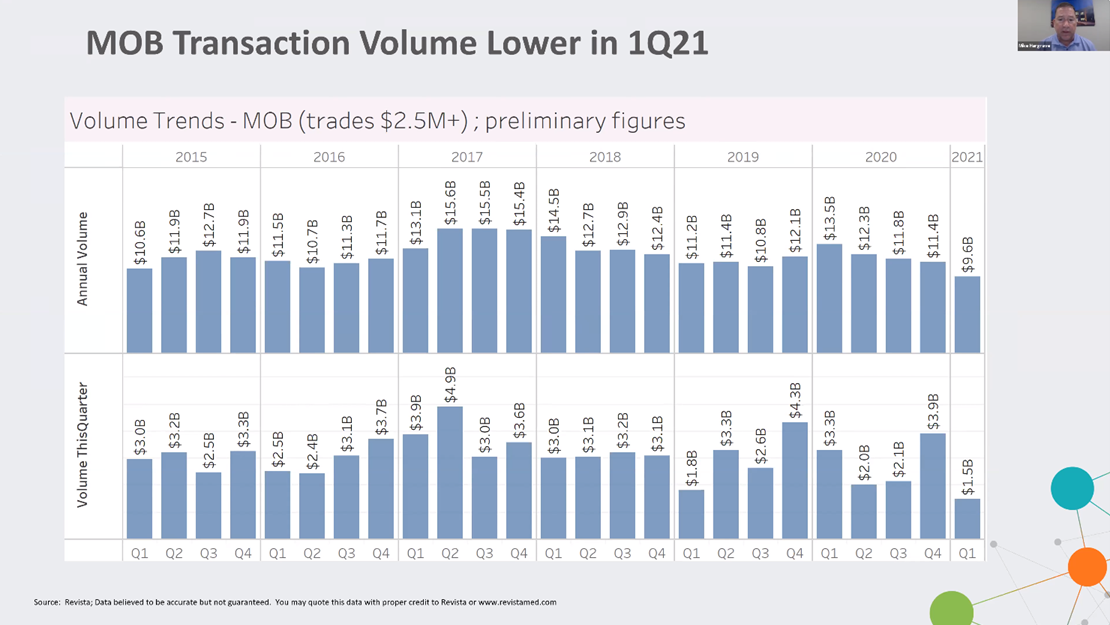
Although 2021 MOB sales got off to a relatively slow start with Q1 volume of $1.5 billion, Revista reminded viewers of its April 22 “Subscriber Webcast” that Q1 2019 volume was similar, yet that year ended up with total sales of $12.1 billion. (HREI™ photo)
After the medical office building (MOB) sales volume rallied in late 2020 to finish off what could be considered a surprisingly strong 2020 – considering that COVID-19 pandemic started early in the year – 2021 is not necessarily off to a strong start.
In fact, preliminary data from Arnold, Md.-based Revista, which provides a wide variety of healthcare real estate (HRE) data for its subscribers, shows that the MOB sales volume in the first quarter (Q1) was about $1.5 billion, down significantly from Q4 2020, when the quarterly volume was a record-setting $3.9 billion.
That Q4 volume, in fact, was the highest quarterly volume that Revista has recorded in its history of tracking such data back to 2015.
Q4 2020 was “a really strong finish to the year,” Revista Principal Mike Hargrave said during the data firm’s Q1 2021 “Subscriber Webcast” April 22. (The quarterly webcast is usually available exclusively to Revista subscribers, but this time the firm also opened it up to attendees of its “Content & Connections” virtual event series.)
2019 started slowly, too
During the pandemic-ridden year of 2020, MOB sales defied the odds and ended up with a total volume of $11.5 billion, only about 5 percent less than what was considered “strong” volume of $12.1 billion in 2019, according to Revista data.
However, Mr. Hargrave said, “So far in 2021 – and I want to just note that these are preliminary figures that are subject to change – volume is looking like it’s going to be weaker, starting off in the first quarter of 2021.”
It should be noted, however, that 2019 also got off to a slow start, with the Q1 sales volume coming in at $1.8 billion. The rest of the year saw strong sales, with the yearly volume ending up at $12 billion. Numerous professionals involved in MOB sales and acquisitions tell HREI™ that 2021 could still end up with a strong total volume.
Mr. Hargrave, who provided MOB sales volume and construction updates, was joined on the webcast by Principal Hilda Martin, who provided data on the size of the HRE market as well as certain MOB fundamentals in the country’s top 50 markets, including leasing absorption rates and rental rate growth.
So far in 2021, as Mr. Hargrave noted, average MOB pricing has dropped a bit, with the median capitalization (cap) rate, or expected first-year return, rising to 6.3 percent on a trailing 12-month (TTM) basis in Q1. That was up from 5.9 percent in Q4 and 6.1 percent in Q3 – both on a TTM basis – of 2020.
“In general, cap rates have been holding steady during in the pandemic,” Mr. Hargrave said. “So far in the first quarter of 2021, however, we are showing a slight bump back. This could just be a natural pullback, but it does bear watching, and we will be watching to see if this is … a trend due to rising interest rates or just the effects of the ongoing pandemic. At this point, we are hesitant to call it any kind of a trend until we see more data on the recovery in our database.”
Fewer, but higher ticket, construction projects
As for the construction of healthcare facilities, both hospitals and MOBs, the numbers remained quite strong in Q1.
As of Q1 2021, there were 394 hospital projects in progress nationwide, which is down 464 projects in progress a year earlier, in Q1 2020. Hospital projects, according to Revista’s report, include acute-care facilities, rehabilitation hospitals and behavioral health hospitals. The projects underway in Q1 2021 have a total of 84.2 million square feet of space – down from 88.4 million square feet in Q1 2020 – and value of $64.1 billion, up from a value of $63.1 billion a year earlier.
Where hospital construction is lagging, is in project starts. As of Q1, there was 23.9 million square feet of hospital space started, down from 33.5 million square feet in Q1 2020.
“Starts are down significantly for general hospitals as of the first quarter of 2021 – so this is really the first quarter that we’ve seen where hospital construction starts are roughly equal to that of MOB starts,” Mr. Hargrave said. “As, usually, the square footage of MOB starts is quite a bit less than hospital starts, because hospitals are larger, etc.”
As for MOB construction, the number of projects in progress as of Q1 was 628, down from the 655 projects in progress in Q1 2020. The total square footage of the projects underway in Q1 2021 was 44.8 million, with the aggregate value being $21.4 billion.
“The one thing I would note about MOB construction is that there are fewer properties under construction even though the square footage is roughly the same as a year ago, and value is higher,” Mr. Hargrave said.
MOB absorption has bounced back
Ms. Martin’s presentation was focused on the occupancy, absorption and rental rates of MOBs with more than 7,500 square feet in the country’s top 50 markets.
According to Revista, the MOB occupancy rate in those markets was 91.6 percent in Q1, up from 91.5 percent in Q4 2020. The absorption of MOB space in the top 50 markets was 12.1 million square feet on a TTM basis in Q1 2021, a decrease of about 15 percent from the 14.3 million square feet absorbed in Q4 on a TTM basis.
However, the total quarterly absorption rate in Q1 – not on a TTM basis – was 3.3 million square feet in the top 50 markets, a 13 percent decrease from Q4 2020 but still part of a rebound from a dismal Q3 2020, when just 800,000 square feet of MOB space was absorbed in the top 50 markets.
Since then, as Ms. Martin noted, absorption has bounced back.
As for average MOB triple-net rental rates, they stood at $22.75 per square foot (PSF) in Q1 2020, reflecting a year-over-over rental growth rate of 1.9 percent, which was above the average rental growth rate in all four quarters of 2020.
The statistics show, according to Ms. Martin, “how needs-based MOBs are, how insulated they are, and you can see that in the occupancy rates, in the absorption, in the rents. If you look at the (MOB data in these categories), you see the steadiness throughout the entirety of last year and into this year. This is also what we saw throughout and after the Great Financial Crisis.
“That being said, it’s not that we did not see any effects (from the pandemic), as we saw a slowdown in rent growth towards the middle of 2020, but that really started to pick up towards the end and then into the beginning of 2021.”
Other topics, data covered
During the remainder of the webcast, Mr. Hargrave and Ms. Martin presented plenty of other statistics, including the following:
■ As for the size of the HRE facilities market, Ms. Martin noted that Revista’s data shows a total of 36,462 MOBs in the country with a total of 1.5 billion square feet of space. She said the definition of what constitutes an MOB is quite broad, as they can include a traditional MOB, an ambulatory surgery center (ASC), an urgent care facility, a freestanding emergency department (FED) and others. As for the size of the hospital market, there are about 5,777 inpatient facilities in the country with a total of about 1.5 billion square feet – same as MOBs. “Combined, the value of HRE facilities is about $1.1 trillion of healthcare real estate base across the United States.”
■ When it comes to MOB growth, Ms. Martin noted that newly delivered projects typically account for about 1.5 to 2 percent of the current inventory annually. “We really see very measured growth in the MOB inventory … and the lion’s share of that tends to be pre-leased or driven by a hospital or health system, so it’s very measured growth that we tend to see off of this base of inventory.”
■ As has been noted quite often in the last year or so, the country’s HRE-focused real estate investment trusts (REITs) have seen, as a group, their share of the MOB acquisition market drop over that timeframe. Revista’s data shows that the trend is continuing, at least so far, in 2021. According to Revista’s data, the REITs accounted for about 32 percent of all MOB acquisitions in 2019, with that figure falling to 17 percent in 2020. In Q1 of this year, the REITs’ share of the total MOB volume fell to 9 percent – again, that figure could be considered preliminary.
■ The largest MOB buyer cohort in Q1 was, by a long shot, private investors, a group that accounted for 70 percent of all purchases. That was up ever so slightly from 2020, when private investors accounted for 69 percent of the MOB yearly volume. The country’s hospital and health systems accounted for about 15 percent of all MOB purchases in Q1, which was up 5 percentage points from 2020, when they accounted for 10 percent of acquisitions. “This reflects the more favorable capital conditions for private equity, and the fact that the capital flows have been going towards that portion of the sector, where financing is easier to get, etc.,” Mr. Hargrave said, adding that the private investor category includes, “small company private equity as well as institutional private equity, investment funds, and other entities along those lines.”
■ As of Jan. 1, 2020, hospital and health systems remained the largest owner of MOBs, with a 52 percent market share. Next in line were private investors, which as a group own 24 percent of the MOB inventory, followed by REITs with 13 percent and provider/owners with 10 percent.
The full content of this article is only available to paid subscribers. If you are an active subscriber, please log in. To subscribe, please click here: SUBSCRIBE