


Figures | Medical Outpatient Buildings | Q1 2026
MOB Investment Rises, Cap Rates Fall
CBRE RESEARCH | MAY 2026
Note: Arrows indicate change from the previous quarter.
Investment volume is compiled using the MSCI transactional database and deals reported by CBRE Healthcare Capital Markets and CBRE Healthcare Practice Advisory Group.
Executive Summary
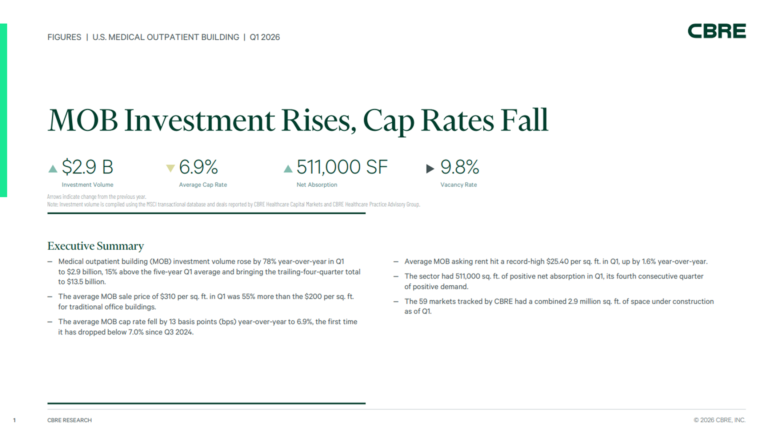
• Medical outpatient building (MOB) investment volume rose by 78% year-over-year in Q1 to $2.9 billion, 15% above the five-year Q1 average and bringing the trailing-four-quarter total to $13.5 billion.
• The average MOB sale price of $310 per sq. ft. in Q1 was 55% more than the $200 per sq. ft. for traditional office buildings.
• The average MOB cap rate fell by 13 basis points (bps) year-over-year to 6.9%, the first time it has dropped below 7.0% since Q3 2024.
• Average MOB asking rent hit a record-high $25.40 per sq. ft. in Q1, up by 1.6% year-over-year.
• The sector had 511,000 sq. ft. of positive net absorption in Q1, its fourth consecutive quarter of positive demand.
• The 59 markets tracked by CBRE had a combined 2.9 million sq. ft. of space under construction as of Q1.
For more information, please contact:
Chris Bodnar
Vice Chairman
Investment Properties
+1 720 635 2653
Brannan Knott
Executive Vice President
Investment Properties
+1 443 983 6039
Zack Holderman
Senior Vice President
Debt & Structured Finance
+1 858 337 9412
Anthony Sardo
Senior Vice President
Debt & Structured Finance
+1 978 337 9980
Cole Reethof
First Vice President
Investment Properties
+1 404 504 7864
Jesse Greshin
Vice President
Debt & Structured Finance
+1 860 808 4810
cbre.com/insights
The full content of this article is only available to paid subscribers. If you are an active subscriber, please log in. To subscribe, please click here: SUBSCRIBE