


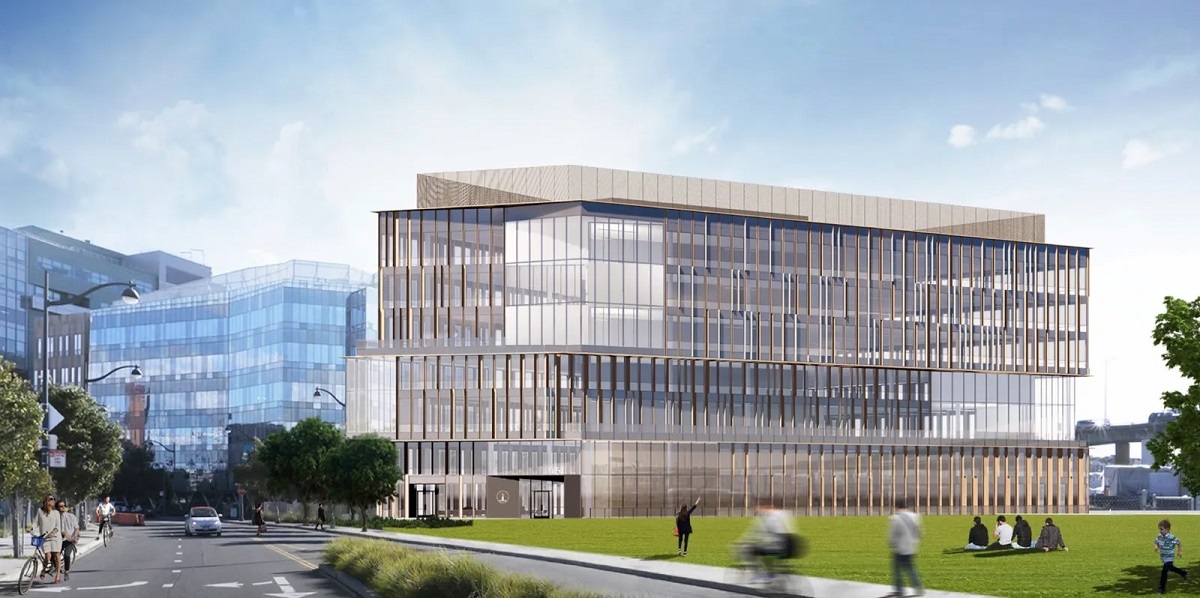
During Q4, Alexandria started two new development projects totaling 467,567 square feet. One was 1450 Owens St., a seven-story, 212,796 square foot lab and office project in San Francisco’s Mission Bay area.
PASADENA, Calif., Jan. 30, 2023 /PRNewswire/ — Alexandria Real Estate Equities, Inc. (NYSE: ARE) announced financial and operating results for the fourth quarter and year ended December 31, 2022.
|
Key highlights |
|||||||
|
Operating results |
4Q22 |
4Q21 |
2022 |
2021 |
|||
|
Total revenues: |
|||||||
|
In millions |
$ 670.3 |
$ 576.9 |
$ 2,589.0 |
$ 2,114.2 |
|||
|
Growth |
16.2 % |
22.5 % |
|||||
|
Net income attributable to Alexandria’s common stockholders – diluted |
|||||||
|
In millions |
$ 51.8 |
$ 72.8 |
$ 513.3 |
$ 563.4 |
|||
|
Per share |
$ 0.31 |
$ 0.47 |
$ 3.18 |
$ 3.82 |
|||
|
Funds from operations attributable to Alexandria’s common stockholders – diluted, as adjusted |
|||||||
|
In millions |
$ 353.6 |
$ 303.6 |
$ 1,361.7 |
$ 1,144.9 |
|||
|
Per share |
$ 2.14 |
$ 1.97 |
$ 8.42 |
$ 7.76 |
|||
An operationally excellent, industry-leading REIT with a high-quality client base of approximately 1,000 tenants supporting high-quality revenues, cash flows, and strong margins
|
Percentage of total annual rental revenue in effect from investment-grade or |
48 % |
|||
|
Sustained strength in tenant collections: |
||||
|
Tenant receivables as of December 31, 2022 |
$ 7.6 |
million |
||
|
January 2023 tenant rent and receivables collected as of January 30, 2023 |
99.4 % |
|||
|
Occupancy of operating properties in North America |
94.8 % |
|||
|
Operating margin |
70 % |
|||
|
Adjusted EBITDA margin |
69 % |
|||
|
Weighted-average remaining lease term: |
||||
|
All tenants |
7.1 |
years |
||
|
Top 20 tenants |
9.4 |
years |
||
Second-highest annual leasing volume and rental rate increases (cash basis)
- Annual leasing volume of 8.4 million RSF in 2022 represents the second highest in Company history, with 74% generated from our client base of approximately 1,000 tenants.
- 4Q22 leasing volume of 2.0 million RSF represents the fourth highest in Company history.
- Rental rate increase (cash basis) of 22.1% on lease renewals and re-leasing of space represents the second-highest rental rate growth (cash basis) in Company history.
|
4Q22 |
2022 |
||||
|
Total leasing activity – RSF |
2,000,322 |
8,405,587 |
|||
|
Lease renewals and re-leasing of space: |
|||||
|
RSF (included in total leasing activity above) |
1,494,345 |
4,540,325 |
|||
|
Rental rate increases |
26.0 % |
(1) |
31.0 % |
||
|
Rental rate increases (cash basis) |
19.6 % |
(1) |
22.1 % |
|
(1) |
Includes rental rate increases related to two recently acquired office leases, including one lease subject to a fixed-rate renewal option and one full-building lease in a non-core submarket. Excluding these leases, rental rate increases for the three months ended December 31, 2022 were 36.8% and 31.4% (cash basis). |
Continued strong net operating income and internal growth, including highest annual same property and third-highest quarterly same property growth (cash basis)
- Net operating income (cash basis) of $1.7 billion for 4Q22 annualized, up $248.4 million, or 17.3%, compared to 4Q21 annualized.
- 96% of our leases contain contractual annual rent escalations approximating 3%.
- Same property net operating income growth:
- 4.7% and 10.9% (cash basis) for 4Q22 over 4Q21, representing the third-highest (cash basis) growth in Company history.
- 6.6% and 9.6% (cash basis) for 2022 over 2021, with both increases representing the highest growth in Company history.
- Our 2022 same property growth outperformed our 10-year averages of 3.6% and 6.7% (cash basis) as a result of an increase in same property occupancy of 100 bps and early lease renewals that commenced in late 2021/early 2022.
Continued strong and flexible balance sheet with lowest leverage in Company history and 13.2 years of remaining term of outstanding debt
- Investment-grade credit ratings ranked in the top 10% among all publicly traded U.S. REITs.
- Net debt and preferred stock to Adjusted EBITDA of 5.1x, the lowest ratio in Company history, and fixed-charge coverage ratio of 5.0x for 4Q22 annualized.
- Total debt and preferred stock to gross assets of 25%.
- 99.4% of our debt has a fixed rate.
- 13.2 years weighted-average remaining term of debt.
- No debt maturities prior to 2025.
- $5.3 billion of liquidity.
- $1.4 billion of contractual construction funding commitments from existing real estate joint venture partners expected over the next four years.
Continued strong, consistent, and increasing dividends with a focus on retaining significant net cash flows from operating activities after dividends for reinvestment
- Common stock dividend declared for 4Q22 of $1.21 per common share, aggregating $4.72 per common share for the year ended December 31, 2022, up 24 cents, or 5%, over the year ended December 31, 2021.
- Dividend yield of 3.3% as of December 31, 2022.
- Dividend payout ratio of 58% for the three months ended December 31, 2022.
- Average annual dividend per-share growth of 6.5% over the last five years.
Alexandria’s value-creation pipeline drives visibility for future growth aggregating over $655 million of incremental net operating income
Highly leased value-creation pipeline of current and seven near-term projects expected to generate greater than $655 million of incremental net operating income, primarily commencing from 1Q23 through 4Q25.
- 7.6 million RSF of value-creation projects, which are 72% leased.
- 77% of the leased RSF of our value-creation projects was generated from our client base of approximately 1,000 tenants.
Key items included in operating results
|
Key items included in net income attributable to Alexandria’s common stockholders: |
|||||||||||||||
|
4Q22 |
4Q21 |
4Q22 |
4Q21 |
2022 |
2021 |
2022 |
2021 |
||||||||
|
(In millions, except per share |
Amount |
Per Share – |
Amount |
Per Share – |
|||||||||||
|
Impairment of real estate |
$ (26.2) |
$ — |
$ (0.16) |
$ — |
$ (65.0) |
$ (52.7) |
$ (0.40) |
$ (0.35) |
|||||||
|
Loss on early |
— |
— |
— |
— |
(3.3) |
(67.3) |
(0.02) |
(0.46) |
|||||||
|
Gain on sales of real estate |
— |
124.2 |
— |
0.80 |
537.9 |
126.6 |
3.33 |
0.86 |
|||||||
|
Acceleration of stock |
— |
— |
— |
— |
(7.2) |
— |
(0.04) |
— |
|||||||
|
Unrealized (losses) gains |
(24.1) |
(139.7) |
(0.15) |
(0.91) |
(412.2) |
43.6 |
(2.55) |
0.30 |
|||||||
|
Impairment of non-real |
(20.5) |
— |
(0.12) |
— |
(20.5) |
— |
(0.13) |
— |
|||||||
|
Significant realized gains on |
— |
— |
— |
— |
— |
110.1 |
— |
0.75 |
|||||||
|
Total |
$ (70.8) |
$ (15.5) |
$ (0.43) |
$ (0.11) |
$ 29.7 |
$ 160.3 |
$ 0.19 |
$ 1.10 |
|||||||
|
Refer to “Funds from operations and funds from operations per share” of this Earnings Press Release for additional |
|||||||||||||||
Strong balance sheet management
Key metrics as of December 31, 2022
- $35.0 billion in total market capitalization.
- $24.9 billion in total equity capitalization, which ranks in the top 10% among all publicly traded U.S. REITs.
- No remaining LIBOR-based debt ahead of June 2023 phase-out.
|
4Q22 |
Goal |
||||||
|
Quarter |
Trailing |
4Q23 |
|||||
|
Annualized |
12 Months |
Annualized |
|||||
|
Net debt and preferred stock to |
5.1x |
5.2x |
Less than or equal to 5.1x |
||||
|
Fixed-charge coverage ratio |
5.0x |
5.0x |
4.5x to 5.0x |
||||
Key capital events
- During 4Q22, we settled outstanding forward equity sales agreements by issuing 8.0 million shares of common stock at an average price of $186.87 and received net proceeds of $1.5 billion.
- In December 2022, we entered into new forward equity sales agreements aggregating $104.7 million to sell 699,274 shares under our ATM program at an average price of $149.68 per share (before underwriter discounts). We expect to settle these forward equity sales agreements in 2023.
- As of December 31, 2022, the remaining aggregate amount available under our ATM program for future sales of common stock was $141.9 million. We expect to establish a new ATM program in 1Q23.
Investments
- As of December 31, 2022:
- Our non-real estate investments aggregated $1.6 billion.
- Unrealized gains presented in our consolidated balance sheet were $397.0 million, comprising gross unrealized gains and losses aggregating $506.4 million and $109.4 million, respectively.
- Investment loss of $19.7 million for the three months ended December 31, 2022 presented in our consolidated statement of operations consisted of $25.0 million of realized gains, $24.1 million of unrealized losses/changes in fair value, and $20.5 million of impairments primarily related to three non-real estate investments in privately held entities that do not report NAV.
External growth and investments in real estate
Delivery and commencement of value-creation projects
- During 4Q22, we placed into service development and redevelopment projects aggregating 497,755 RSF across multiple submarkets, resulting in $28 million of incremental annual net operating income.
- Annual net operating income (cash basis) is expected to increase by $57 million upon the burn-off of initial free rent from recently delivered projects.
- Commenced two development projects aggregating 467,567 RSF during 4Q22, including 212,796 RSF at 1450 Owens Street in our Mission Bay submarket, which will be 100% funded by our joint venture partner, and 254,771 RSF at 10075 Barnes Canyon Road in our Sorrento Mesa submarket, which will be 50% funded by our joint venture partner.
|
Value-creation pipeline of new Class A development and redevelopment projects as |
4Q22 |
|
|
Under construction projects 68% leased/negotiating |
10 % |
|
|
Near-term projects expected to commence construction in the next four quarters |
2 % |
|
|
Income-producing/potential cash flows/covered land play(1) |
7 % |
|
|
Land |
3 % |
|
|
(1) |
Includes projects that have existing buildings that are generating or can generate operating cash flows. Also includes development rights associated with existing operating campuses. These projects aggregate 1.1% of total annual rental revenue as of December 31, 2022 and are included in targeted for a future change in use in our industry mix chart. Refer to “High-quality and diverse client base in AAA locations” in our Supplemental Information. |
- 81% of construction costs related to active development and redevelopment projects aggregating 5.6 million RSF are under a guaranteed maximum price (“GMP”) contract or other fixed contracts. Our budgets also include construction cost contingencies in GMP contracts plus additional landlord contingencies that generally range from 3% to 5%.
Industry and ESG leadership: catalyzing and leading the way for positive change to benefit human health and society
- In January 2023, Alexandria Venture Investments was recognized by Silicon Valley Bank in its “Healthcare Investments and Exits: Annual Report 2022” as the #1 most active corporate investor in biopharma by new deal volume (2021-2022) for the sixth consecutive year. Alexandria’s venture activity provides us with, among other things, mission-critical data on and insights into key macro life science industry and innovation trends.
- In November 2022, our executive chairman and founder, Joel S. Marcus, presented at the much-anticipated Annual Baron Investment Conference for a rare second time. Mr. Marcus opened the program with a presentation on what renowned author and business strategist Jim Collins describes as our “Superior Results, Distinctive Impact, and Lasting Endurance.”
- In November 2022, Alexandria earned several 2022 TOBY (The Outstanding Building of the Year) Awards from BOMA (Building Owners and Managers Association) in Boston, Seattle, and Raleigh-Durham. The TOBY Awards recognize quality in commercial buildings and reward excellence in building management.
- In our Cambridge/Inner Suburbs submarket: Four recognitions across three of our premier mega campuses – Alexandria Center® at Kendall Square, Alexandria Center® at One Kendall Square, and Alexandria Technology Square® – for Corporate Facility, Laboratory Building, Renovated Building, and Building Under 100,000 SF categories.
- In our Lake Union submarket: A recognition for 1165 Eastlake Avenue East on The Eastlake Life Science Campus by Alexandria mega campus in the Corporate Facility category.
- In our Research Triangle submarket: A recognition for 9 Laboratory Drive on our Alexandria Center® for AgTech campus in the Life Science category.
- In October 2022, Mr. Marcus, as a newly appointed member of the Prix Galien USA’s esteemed Awards jury, honored groundbreaking medical innovations in life science. He served on the Prix Galien committee, alongside other influential science leaders, that recognized the Best Startup, Best Digital Health Solution and the inaugural Best Incubators, Accelerators and Equity.
- In October 2022, 9880 Campus Point Drive on the Campus Point by Alexandria mega campus in our University Town Center submarket received an Orchid award for Architecture from the San Diego Architectural Foundation, and a People’s Choice Orchid. The facility is home to Alexandria GradLabs®, a dynamic platform that is accelerating the growth of promising early-stage life science companies.
- Alexandria is addressing some of today’s most urgent societal challenges through our eight social responsibility pillars, including the mental health crisis and opioid addiction. In October 2022:
- Alexandria presented a timely conversation on the state of mental health in America with former congressman Patrick J. Kennedy, one of the world’s leading voices and policymakers on mental health, at the Galien Forum USA 2022, which was held at the Alexandria Center® for Life Science – New York City.
- OneFifteen, a novel, data-driven comprehensive care model we developed in partnership with Verily, celebrated its third anniversary of the campus’s opening in Dayton, Ohio. OneFifteen has treated over 5,800 patients since opening its doors in October 2019.
About Alexandria Real Estate Equities, Inc.
Alexandria Real Estate Equities, Inc. (NYSE: ARE), an S&P 500® company, is a best-in-class, mission-driven life science REIT making a positive and lasting impact on the world. As the pioneer of the life science real estate niche since its founding in 1994, Alexandria is the preeminent and longest-tenured owner, operator, and developer of collaborative life science, agtech, and technology campuses in AAA innovation cluster locations, including Greater Boston, the San Francisco Bay Area, New York City, San Diego, Seattle, Maryland, and Research Triangle. The trusted partner to approximately 1,000 tenants, Alexandria has a total market capitalization of $35.0 billion and an asset base in North America of 74.6 million square feet (“SF”) as of December 31, 2022, which includes 41.8 million RSF of operating properties and 5.6 million RSF of Class A properties undergoing construction, 9.9 million RSF of near-term and intermediate-term development and redevelopment projects, and 17.3 million SF of future development projects. Alexandria has a longstanding and proven track record of developing Class A properties clustered in life science, agtech, and technology campuses that provide our innovative tenants with highly dynamic and collaborative environments that enhance their ability to successfully recruit and retain world-class talent and inspire productivity, efficiency, creativity, and success. Alexandria also provides strategic capital to transformative life science, agrifoodtech, climate innovation, and technology companies through our venture capital platform. We believe our unique business model and diligent underwriting ensure a high-quality and diverse tenant base that results in higher occupancy levels, longer lease terms, higher rental income, higher returns, and greater long-term asset value. For additional information on Alexandria, please visit www.are.com.
|
Acquisitions |
|||||||||||||||||||||
|
Square Footage |
|||||||||||||||||||||
|
Acquisitions With Development/Redevelopment |
|||||||||||||||||||||
|
Property |
Submarket/Market |
Date of |
Number of |
Operating |
Future |
Operating With |
Operating(2) |
Total(3) |
Purchase Price |
||||||||||||
|
Completed in YTD 3Q22 |
39 |
92 |
% |
6,538,991 |
3,305,764 |
451,760 |
9,600,231 |
$ |
2,437,592 |
||||||||||||
|
Completed in 4Q22: |
|||||||||||||||||||||
|
35 Gatehouse Drive(4) |
Route 128/Greater Boston |
12/29/22 |
1 |
100 |
75,000 |
31,611 |
265,965 |
372,576 |
272,500 |
||||||||||||
|
1001 Trinity Street and 1020 Red River Street |
Austin/Texas |
10/4/22 |
2 |
100 |
51,038 |
198,972 |
— |
250,010 |
108,000 |
||||||||||||
|
Other |
360 |
||||||||||||||||||||
|
3 |
100 |
126,038 |
230,583 |
(5) |
265,965 |
(5) |
622,586 |
380,860 |
|||||||||||||
|
Total 2022 acquisitions |
42 |
93 |
% |
6,665,029 |
3,536,347 |
717,725 |
10,222,817 |
$ |
2,818,452 |
||||||||||||
|
(1) |
We expect to provide total estimated costs and related yields for development and redevelopment projects in the future, subsequent to the commencement of construction. |
|
(2) |
Represents the operating component of our value-creation acquisitions that is not expected to undergo future development or redevelopment. |
|
(3) |
Represents total square footage upon completion of development or redevelopment of one or more new Class A properties. Square footage presented includes RSF of buildings currently in operation with future development or redevelopment opportunities. Refer to “Definitions and reconciliations” in our Supplemental Information for additional details on value-creation square feet currently included in rental properties. |
|
(4) |
Represents an opportunity to expand our existing properties at 40, 50, and 60 Sylvan Road and 840 Winter Street into a mega campus. |
|
(5) |
We expect the acquisitions completed during the three months ended December 31, 2022 to generate initial annual net operating income of approximately $28 million for the twelve months following acquisition. These acquisitions included three operating properties with a weighted-average acquisition date of December 8, 2022 (weighted by initial annual net operating income). |
|
Dispositions and Sales of Partial Interests |
||||||||||||||||||||||||||
|
Property |
Submarket/Market |
Date of |
Interest |
RSF |
Capitalization |
Capitalization |
Sales Price |
Sales Price |
Gain or |
|||||||||||||||||
|
100 Binney Street |
Cambridge/Inner Suburbs/ Greater Boston |
3/30/22 |
70 % |
432,931 |
3.6 % |
3.5 % |
$ 713,228 |
(1) |
$ 2,353 |
$ 413,615 |
(2) |
|||||||||||||||
|
300 Third Street |
Cambridge/Inner Suburbs/ Greater Boston |
6/27/22 |
70 % |
131,963 |
4.6 % |
4.3 % |
166,485 |
(1) |
$ 1,802 |
113,020 |
(2) |
|||||||||||||||
|
Alexandria Park at 128, 285 Bear Hill |
Route 128 and Route 495/ Greater Boston |
6/8/22 |
100 % |
617,043 |
5.1 % |
5.1 % |
334,397 |
$ 542 |
202,325 |
|||||||||||||||||
|
1450 Owens Street |
Mission Bay/San Francisco Bay Area |
7/1/22 |
20 % |
(3) |
191,000 |
N/A |
N/A |
25,039 |
(1) |
N/A |
10,083 |
(2) |
||||||||||||||
|
341 and 343 Oyster Point Boulevard, |
South San Francisco and Greater |
9/15/22 |
100 % |
330,379 |
5.2 % |
5.2 % |
383,635 |
$ 1,161 |
223,127 |
|||||||||||||||||
|
3215 Merryfield Row |
Torrey Pines/San Diego |
9/1/22 |
70 % |
170,523 |
4.5 % |
4.2 % |
149,940 |
(1) |
$ 1,256 |
42,214 |
(2) |
|||||||||||||||
|
Summers Ridge Science Park |
Sorrento Mesa/San Diego |
9/15/22 |
70 % |
316,531 |
4.9 % |
4.6 % |
159,600 |
(1) |
$ 720 |
65,097 |
(2) |
|||||||||||||||
|
7330 and 7360 Carroll Road |
Sorrento Mesa/San Diego |
9/15/22 |
100 % |
84,442 |
4.4 % |
4.6 % |
59,476 |
$ 704 |
35,463 |
|||||||||||||||||
|
Other |
Various |
N/A |
N/A |
230,496 |
N/A |
77,003 |
||||||||||||||||||||
|
Total 2022 dispositions and sales of |
$ 2,222,296 |
$ 1,181,947 |
||||||||||||||||||||||||
|
(1) |
Represents the contractual sales price for the percentage interest of the property sold by us. |
|
(2) |
We retained control over the newly formed real estate joint venture and therefore continued to consolidate this property. We accounted for the difference between the consideration received and the book value of the interest sold as an equity transaction, with no gain or loss recognized in earnings. |
|
(3) |
Relates to the sale of a partial interest in a land parcel. The noncontrolling interest share of our joint venture partner is anticipated to increase to 75% as our partner contributes capital for construction over time. As of December 31, 2022, the noncontrolling interest share of our joint venture partner was 40.3%. |
|
Guidance |
||
|
The following guidance is based on our current view of existing market conditions and assumptions for the year ending December 31, 2023 and is consistent with the guidance issued on our Form 8-K filed on November 30, 2022, except for an update to “excess 2022 bond capital held as cash at December 31, 2022,” which reflects the actual amount of $300 million as of December 31, 2022, compared to the prior guidance range from $200 million to $300 million. |
||
|
There can be no assurance that actual 2023 results will not be materially higher or lower than these expectations. Also, refer to our discussion of “forward-looking statements” on page 7 of this Earnings Press Release for additional details. |
||
|
Projected 2023 Earnings per Share and Funds From Operations per Share Attributable to |
||
|
Earnings per share(1) |
$3.41 to $3.61 |
|
|
Depreciation and amortization of real estate assets |
5.50 |
|
|
Allocation to unvested restricted stock awards |
(0.05) |
|
|
Funds from operations per share(2) |
$8.86 to $9.06 |
|
|
Midpoint |
$8.96 |
|
|
Key Assumptions |
Low |
High |
|||
|
Occupancy percentage in North America as of December 31, 2023 |
94.8 % |
95.8 % |
|||
|
Lease renewals and re-leasing of space: |
|||||
|
Rental rate increases |
27.0 % |
32.0 % |
|||
|
Rental rate increases (cash basis) |
11.0 % |
16.0 % |
|||
|
Same property performance: |
|||||
|
Net operating income increase |
2.0 % |
4.0 % |
|||
|
Net operating income increase (cash basis) |
4.0 % |
6.0 % |
|||
|
Straight-line rent revenue |
$ 130 |
$ 145 |
|||
|
General and administrative expenses |
$ 183 |
$ 193 |
|||
|
Capitalization of interest |
$ 342 |
$ 362 |
|||
|
Interest expense |
$ 74 |
$ 94 |
|
Key Credit Metrics |
2023 Guidance |
|
|
Net debt and preferred stock to Adjusted EBITDA – 4Q23 annualized |
Less than or equal to 5.1x |
|
|
Fixed-charge coverage ratio – 4Q23 annualized |
4.5x to 5.0x |
|
Key Sources and Uses of Capital |
Range |
Midpoint |
|||||
|
Sources of capital: |
|||||||
|
Incremental debt |
$ 550 |
$ 850 |
$ 700 |
||||
|
Excess 2022 bond capital held as cash at December 31, |
300 |
300 |
300 |
||||
|
Net cash provided by operating activities after dividends |
350 |
400 |
375 |
||||
|
Real estate dispositions, sales of partial interests, and |
1,400 |
2,400 |
1,900 |
(3) |
|||
|
Total sources of capital |
$ 2,600 |
$ 3,950 |
$ 3,275 |
||||
|
Uses of capital: |
|||||||
|
Construction (refer to page 48) |
$ 2,400 |
$ 3,550 |
$ 2,975 |
||||
|
Acquisitions (refer to page 4) |
200 |
400 |
300 |
||||
|
Total uses of capital |
$ 2,600 |
$ 3,950 |
$ 3,275 |
||||
|
Incremental debt (included above): |
|||||||
|
Issuance of unsecured senior notes payable |
$ 500 |
$ 1,000 |
$ 750 |
||||
|
Unsecured senior line of credit, commercial paper, and other |
50 |
(150) |
(50) |
||||
|
Incremental debt |
$ 550 |
$ 850 |
$ 700 |
||||
|
(1) |
Excludes unrealized gains or losses after December 31, 2022 that are required to be recognized in earnings and are excluded from funds from operations per share, as adjusted. |
|
(2) |
Refer to “Funds from operations and funds from operations, as adjusted, attributable to Alexandria’s common stockholders” in the “Definitions and reconciliations” of our Supplemental Information for additional details. |
|
(3) |
Refer to “Key capital events” on page 2 of this Earnings Press Release for additional details. During the three months ended December 31, 2022, we entered into new forward equity sales agreements aggregating $104.7 million to sell 699,274 shares under our ATM program at an average price of $149.68 per share (before underwriter discounts). We expect to settle these forward equity sales agreements in 2023 and establish a new ATM program in 1Q23. |
Earnings Call Information and About the Company
December 31, 2022
We will host a conference call on Tuesday, January 31, 2023, at 3:00 p.m. Eastern Time (“ET”)/noon Pacific Time (“PT”), which is open to the general public, to discuss our financial and operating results for the fourth quarter and year ended December 31, 2022. To participate in this conference call, dial (833) 366-1125 or (412) 902-6738 shortly before 3:00 p.m. ET/noon PT and ask the operator to join the call for Alexandria Real Estate Equities, Inc. The audio webcast can be accessed at www.are.com in the “For Investors” section. A replay of the call will be available for a limited time from 5:00 p.m. ET/2:00 p.m. PT on Tuesday, January 31, 2023. The replay number is (877) 344-7529 or (412) 317-0088, and the access code is 7024203.
Additionally, a copy of this Earnings Press Release and Supplemental Information for the fourth quarter and year ended December 31, 2022 is available in the “For Investors” section of our website at www.are.com or by following this link: https://www.are.com/fs/2022q4.pdf.
For any questions, please contact Joel S. Marcus, executive chairman and founder; Peter M. Moglia, chief executive officer and co-chief investment officer; Dean A. Shigenaga, president and chief financial officer; Paula Schwartz, managing director of Rx Communications Group, at (917) 633-7790; or Sara M. Kabakoff, vice president – strategic communications.
About the Company
Alexandria Real Estate Equities, Inc. (NYSE: ARE), an S&P 500® company, is a best-in-class, mission-driven life science REIT making a positive and lasting impact on the world. As the pioneer of the life science real estate niche since its founding in 1994, Alexandria is the preeminent and longest-tenured owner, operator, and developer of collaborative life science, agtech, and technology campuses in AAA innovation cluster locations, including Greater Boston, the San Francisco Bay Area, New York City, San Diego, Seattle, Maryland, and Research Triangle. The trusted partner to approximately 1,000 tenants, Alexandria has a total market capitalization of $35.0 billion and an asset base in North America of 74.6 million SF as of December 31, 2022, which includes 41.8 million RSF of operating properties and 5.6 million RSF of Class A properties undergoing construction, 9.9 million RSF of near-term and intermediate-term development and redevelopment projects, and 17.3 million SF of future development projects. Alexandria has a longstanding and proven track record of developing Class A properties clustered in life science, agtech, and technology campuses that provide our innovative tenants with highly dynamic and collaborative environments that enhance their ability to successfully recruit and retain world-class talent and inspire productivity, efficiency, creativity, and success. Alexandria also provides strategic capital to transformative life science, agrifoodtech, climate innovation, and technology companies through our venture capital platform. We believe our unique business model and diligent underwriting ensure a high-quality and diverse tenant base that results in higher occupancy levels, longer lease terms, higher rental income, higher returns, and greater long-term asset value. For additional information on Alexandria, please visit www.are.com.
***********
This document includes “forward-looking statements” within the meaning of Section 27A of the Securities Act of 1933, as amended, and Section 21E of the Securities Exchange Act of 1934, as amended. Such forward-looking statements include, without limitation, statements regarding our 2023 earnings per share attributable to Alexandria’s common stockholders – diluted, 2023 funds from operations per share attributable to Alexandria’s common stockholders – diluted, net operating income, and our projected sources and uses of capital. You can identify the forward-looking statements by their use of forward-looking words, such as “forecast,” “guidance,” “goals,” “projects,” “estimates,” “anticipates,” “believes,” “expects,” “intends,” “may,” “plans,” “seeks,” “should,” “targets,” or “will,” or the negative of those words or similar words. These forward-looking statements are based on our current expectations, beliefs, projections, future plans and strategies, anticipated events or trends, and similar expressions concerning matters that are not historical facts, as well as a number of assumptions concerning future events. There can be no assurance that actual results will not be materially higher or lower than these expectations. These statements are subject to risks, uncertainties, assumptions, and other important factors that could cause actual results to differ materially from the results discussed in the forward-looking statements. Factors that might cause such a difference include, without limitation, our failure to obtain capital (debt, construction financing, and/or equity) or refinance debt maturities, lower than expected yields, increased interest rates and operating costs, adverse economic or real estate developments in our markets, our failure to successfully place into service and lease any properties undergoing development or redevelopment and our existing space held for future development or redevelopment (including new properties acquired for that purpose), our failure to successfully operate or lease acquired properties, decreased rental rates, increased vacancy rates or failure to renew or replace expiring leases, defaults on or non-renewal of leases by tenants, adverse general and local economic conditions, an unfavorable capital market environment, decreased leasing activity or lease renewals, failure to obtain LEED and other healthy building certifications and efficiencies, and other risks and uncertainties detailed in our filings with the Securities and Exchange Commission (“SEC”). Accordingly, you are cautioned not to place undue reliance on such forward-looking statements. All forward-looking statements are made as of the date of this Earnings Press Release and Supplemental Information, and unless otherwise stated, we assume no obligation to update this information and expressly disclaim any obligation to update or revise any forward-looking statements, whether as a result of new information, future events, or otherwise. For more discussion relating to risks and uncertainties that could cause actual results to differ materially from those anticipated in our forward-looking statements, and risks to our business in general, please refer to our SEC filings, including our most recent annual report on Form 10-K and any subsequent quarterly reports on Form 10-Q.
Alexandria®, Lighthouse Design® logo, Building the Future of Life-Changing Innovation®, That’s What’s in Our DNA®, At the Vanguard and Heart of the Life Science Ecosystem™, Alexandria Center®, Alexandria Technology Square®, Alexandria Technology Center®, and Alexandria Innovation Center® are copyrights and trademarks of Alexandria Real Estate Equities, Inc. All other company names, trademarks, and logos referenced herein are the property of their respective owners.
|
Consolidated Statements of Operations |
||||||||||||||
|
Three Months Ended |
Year Ended |
|||||||||||||
|
12/31/22 |
9/30/22 |
6/30/22 |
3/31/22 |
12/31/21 |
12/31/22 |
12/31/21 |
||||||||
|
Revenues: |
||||||||||||||
|
Income from rentals |
$ 665,674 |
$ 656,853 |
$ 640,959 |
$ 612,554 |
$ 574,656 |
$ 2,576,040 |
$ 2,108,249 |
|||||||
|
Other income |
4,607 |
2,999 |
2,805 |
2,511 |
2,267 |
12,922 |
5,901 |
|||||||
|
Total revenues |
670,281 |
659,852 |
643,764 |
615,065 |
576,923 |
2,588,962 |
2,114,150 |
|||||||
|
Expenses: |
||||||||||||||
|
Rental operations |
204,352 |
201,189 |
196,284 |
181,328 |
175,717 |
783,153 |
623,555 |
|||||||
|
General and administrative |
42,992 |
49,958 |
43,397 |
40,931 |
41,654 |
177,278 |
151,461 |
|||||||
|
Interest |
17,522 |
22,984 |
24,257 |
29,440 |
34,862 |
94,203 |
142,165 |
|||||||
|
Depreciation and amortization |
264,480 |
254,929 |
242,078 |
240,659 |
239,254 |
1,002,146 |
821,061 |
|||||||
|
Impairment of real estate |
26,186 |
38,783 |
— |
— |
— |
64,969 |
52,675 |
|||||||
|
Loss on early extinguishment of debt |
— |
— |
3,317 |
— |
— |
3,317 |
67,253 |
|||||||
|
Total expenses |
555,532 |
567,843 |
509,333 |
492,358 |
491,487 |
2,125,066 |
1,858,170 |
|||||||
|
Equity in earnings of unconsolidated real estate joint ventures |
172 |
40 |
213 |
220 |
3,018 |
645 |
12,255 |
|||||||
|
Investment (loss) income |
(19,653) |
(32,305) |
(39,481) |
(240,319) |
(112,884) |
(331,758) |
259,477 |
|||||||
|
Gain on sales of real estate |
— |
323,699 |
214,219 |
— |
124,226 |
537,918 |
126,570 |
|||||||
|
Net income (loss) |
95,268 |
383,443 |
309,382 |
(117,392) |
99,796 |
670,701 |
654,282 |
|||||||
|
Net income attributable to noncontrolling interests |
(40,949) |
(38,747) |
(37,168) |
(32,177) |
(24,901) |
(149,041) |
(83,035) |
|||||||
|
Net income (loss) attributable to Alexandria Real Estate Equities, Inc.’s |
54,319 |
344,696 |
272,214 |
(149,569) |
74,895 |
521,660 |
571,247 |
|||||||
|
Net income attributable to unvested restricted stock awards |
(2,526) |
(3,257) |
(2,934) |
(2,081) |
(2,098) |
(8,392) |
(7,848) |
|||||||
|
Net income (loss) attributable to Alexandria Real Estate Equities, Inc.’s |
$ 51,793 |
$ 341,439 |
$ 269,280 |
$ (151,650) |
$ 72,797 |
$ 513,268 |
$ 563,399 |
|||||||
|
Net income (loss) per share attributable to Alexandria Real Estate Equities, |
||||||||||||||
|
Basic |
$ 0.31 |
$ 2.11 |
$ 1.67 |
$ (0.96) |
$ 0.47 |
$ 3.18 |
$ 3.83 |
|||||||
|
Diluted |
$ 0.31 |
$ 2.11 |
$ 1.67 |
$ (0.96) |
$ 0.47 |
$ 3.18 |
$ 3.82 |
|||||||
|
Weighted-average shares of common stock outstanding: |
||||||||||||||
|
Basic |
165,393 |
161,554 |
161,412 |
158,198 |
153,464 |
161,659 |
146,921 |
|||||||
|
Diluted |
165,393 |
161,554 |
161,412 |
158,198 |
154,307 |
161,659 |
147,460 |
|||||||
|
Dividends declared per share of common stock |
$ 1.21 |
$ 1.18 |
$ 1.18 |
$ 1.15 |
$ 1.15 |
$ 4.72 |
$ 4.48 |
|||||||
|
Consolidated Balance Sheets |
||||||||||
|
12/31/22 |
9/30/22 |
6/30/22 |
3/31/22 |
12/31/21 |
||||||
|
Assets |
||||||||||
|
Investments in real estate |
$ 29,945,440 |
$ 28,771,745 |
$ 27,952,931 |
$ 27,100,009 |
$ 24,980,669 |
|||||
|
Investments in unconsolidated real estate joint ventures |
38,435 |
38,285 |
37,587 |
38,456 |
38,483 |
|||||
|
Cash and cash equivalents |
825,193 |
533,824 |
420,258 |
775,060 |
361,348 |
|||||
|
Restricted cash |
32,782 |
332,344 |
97,404 |
95,106 |
53,879 |
|||||
|
Tenant receivables |
7,614 |
7,759 |
7,069 |
7,570 |
7,379 |
|||||
|
Deferred rent |
942,646 |
918,995 |
905,699 |
881,743 |
839,335 |
|||||
|
Deferred leasing costs |
516,275 |
506,864 |
498,434 |
484,184 |
402,898 |
|||||
|
Investments |
1,615,074 |
1,624,921 |
1,657,461 |
1,661,101 |
1,876,564 |
|||||
|
Other assets |
1,599,940 |
1,633,877 |
1,667,210 |
1,801,027 |
1,658,818 |
|||||
|
Total assets |
$ 35,523,399 |
$ 34,368,614 |
$ 33,244,053 |
$ 32,844,256 |
$ 30,219,373 |
|||||
|
Liabilities, Noncontrolling Interests, and Equity |
||||||||||
|
Secured notes payable |
$ 59,045 |
$ 40,594 |
$ 24,986 |
$ 208,910 |
$ 205,198 |
|||||
|
Unsecured senior notes payable |
10,100,717 |
10,098,588 |
10,096,462 |
10,094,337 |
8,316,678 |
|||||
|
Unsecured senior line of credit and commercial paper |
— |
386,666 |
149,958 |
— |
269,990 |
|||||
|
Accounts payable, accrued expenses, and other liabilities |
2,471,259 |
2,393,764 |
2,317,940 |
2,172,692 |
2,210,410 |
|||||
|
Dividends payable |
209,131 |
193,623 |
192,571 |
187,701 |
183,847 |
|||||
|
Total liabilities |
12,840,152 |
13,113,235 |
12,781,917 |
12,663,640 |
11,186,123 |
|||||
|
Commitments and contingencies |
||||||||||
|
Redeemable noncontrolling interests |
9,612 |
9,612 |
9,612 |
9,612 |
9,612 |
|||||
|
Alexandria Real Estate Equities, Inc.’s stockholders’ equity: |
||||||||||
|
Common stock |
1,707 |
1,626 |
1,615 |
1,614 |
1,580 |
|||||
|
Additional paid-in capital |
18,991,492 |
17,639,434 |
17,149,571 |
16,934,094 |
16,195,256 |
|||||
|
Accumulated other comprehensive loss |
(20,812) |
(24,725) |
(11,851) |
(5,727) |
(7,294) |
|||||
|
Alexandria Real Estate Equities, Inc.’s stockholders’ equity |
18,972,387 |
17,616,335 |
17,139,335 |
16,929,981 |
16,189,542 |
|||||
|
Noncontrolling interests |
3,701,248 |
3,629,432 |
3,313,189 |
3,241,023 |
2,834,096 |
|||||
|
Total equity |
22,673,635 |
21,245,767 |
20,452,524 |
20,171,004 |
19,023,638 |
|||||
|
Total liabilities, noncontrolling interests, and equity |
$ 35,523,399 |
$ 34,368,614 |
$ 33,244,053 |
$ 32,844,256 |
$ 30,219,373 |
|||||
|
Funds From Operations and Funds From Operations per Share |
||||||||||||||
|
The following table presents a reconciliation of net income (loss) attributable to Alexandria’s common stockholders, the most directly comparable financial measure presented in accordance with U.S. generally accepted accounting principles (“GAAP”), including our share of amounts from consolidated and unconsolidated real estate joint ventures, to funds from operations attributable to Alexandria’s common stockholders – diluted, and funds from operations attributable to Alexandria’s common stockholders – diluted, as adjusted, for the periods below: |
||||||||||||||
|
Three Months Ended |
Year Ended |
|||||||||||||
|
12/31/22 |
9/30/22 |
6/30/22 |
3/31/22 |
12/31/21 |
12/31/22 |
12/31/21 |
||||||||
|
Net income (loss) attributable to Alexandria’s common stockholders |
$ 51,793 |
$ 341,439 |
$ 269,280 |
$ (151,650) |
$ 72,797 |
$ 513,268 |
$ 563,399 |
|||||||
|
Depreciation and amortization of real estate assets |
261,185 |
251,453 |
238,565 |
237,160 |
234,979 |
988,363 |
804,633 |
|||||||
|
Noncontrolling share of depreciation and amortization from consolidated real |
(29,702) |
(27,790) |
(26,418) |
(23,681) |
(21,265) |
(107,591) |
(70,880) |
|||||||
|
Our share of depreciation and amortization from unconsolidated real estate JVs |
982 |
795 |
934 |
955 |
3,058 |
3,666 |
13,734 |
|||||||
|
Gain on sales of real estate |
— |
(323,699) |
(214,219) |
— |
(124,226) |
(537,918) |
(126,570) |
|||||||
|
Impairment of real estate – rental properties |
20,899 |
(1) |
— |
— |
— |
— |
20,899 |
25,485 |
||||||
|
Allocation to unvested restricted stock awards |
(953) |
1,002 |
— |
— |
— |
(1,118) |
(6,315) |
|||||||
|
Funds from operations attributable to Alexandria’s common stockholders – |
304,204 |
243,200 |
268,142 |
62,784 |
165,343 |
879,569 |
1,203,486 |
|||||||
|
Unrealized losses (gains) on non-real estate investments |
24,117 |
56,515 |
68,128 |
263,433 |
139,716 |
412,193 |
(43,632) |
|||||||
|
Significant realized gains on non-real estate investments |
— |
— |
— |
— |
— |
— |
(110,119) |
|||||||
|
Impairment of non-real estate investments |
20,512 |
(3) |
— |
— |
— |
— |
20,512 |
(3) |
— |
|||||
|
Impairment of real estate |
5,287 |
38,783 |
— |
— |
— |
44,070 |
27,190 |
|||||||
|
Loss on early extinguishment of debt |
— |
— |
3,317 |
— |
— |
3,317 |
67,253 |
|||||||
|
Acceleration of stock compensation expense due to executive officer resignation |
— |
7,185 |
— |
— |
— |
7,185 |
— |
|||||||
|
Allocation to unvested restricted stock awards |
(482) |
(1,033) |
(778) |
(1,604) |
(1,432) |
(5,137) |
710 |
|||||||
|
Funds from operations attributable to Alexandria’s common stockholders – |
$ 353,638 |
$ 344,650 |
$ 338,809 |
$ 324,613 |
$ 303,627 |
$ 1,361,709 |
$ 1,144,888 |
|||||||
|
(1) |
Primarily consists of an impairment of one real estate asset recognized to reduce the carrying amount of the asset to its estimated fair value, less costs to sell, upon its classification as held for sale in December 2022. We expect to complete the sale of this asset during 2023. |
|
(2) |
Calculated in accordance with standards established by the Nareit Board of Governors. |
|
(3) |
Primarily relates to three investments in privately held entities that do not report NAV. |
|
Funds From Operations and Funds From Operations per Share (continued) |
||||||||||||||
|
The following table presents a reconciliation of net income (loss) per share attributable to Alexandria’s common stockholders, the most directly comparable financial measure presented in accordance with GAAP, including our share of amounts from consolidated and unconsolidated real estate joint ventures, to funds from operations per share attributable to Alexandria’s common stockholders – diluted, and funds from operations per share attributable to Alexandria’s common stockholders – diluted, as adjusted, for the periods below. Per share amounts may not add due to rounding. |
||||||||||||||
|
Three Months Ended |
Year Ended |
|||||||||||||
|
12/31/22 |
9/30/22 |
6/30/22 |
3/31/22 |
12/31/21 |
12/31/22 |
12/31/21 |
||||||||
|
Net income (loss) per share attributable to Alexandria’s common |
$ 0.31 |
$ 2.11 |
$ 1.67 |
$ (0.96) |
$ 0.47 |
$ 3.18 |
$ 3.82 |
|||||||
|
Depreciation and amortization of real estate assets |
1.41 |
1.39 |
1.32 |
1.36 |
1.40 |
5.47 |
5.07 |
|||||||
|
Gain on sales of real estate |
— |
(2.00) |
(1.33) |
— |
(0.80) |
(3.33) |
(0.86) |
|||||||
|
Impairment of real estate – rental properties |
0.13 |
(1) |
— |
— |
— |
— |
0.13 |
0.17 |
||||||
|
Allocation to unvested restricted stock awards |
(0.01) |
0.01 |
— |
— |
— |
(0.01) |
(0.04) |
|||||||
|
Funds from operations per share attributable to Alexandria’s common |
1.84 |
1.51 |
1.66 |
0.40 |
1.07 |
5.44 |
8.16 |
|||||||
|
Unrealized losses (gains) on non-real estate investments |
0.15 |
0.35 |
0.42 |
1.67 |
0.91 |
2.55 |
(0.30) |
|||||||
|
Significant realized gains on non-real estate investments |
— |
— |
— |
— |
— |
— |
(0.75) |
|||||||
|
Impairment of non-real estate investments |
0.12 |
(1) |
— |
— |
— |
— |
0.13 |
(1) |
— |
|||||
|
Impairment of real estate |
0.03 |
0.24 |
— |
— |
— |
0.27 |
0.18 |
|||||||
|
Loss on early extinguishment of debt |
— |
— |
0.02 |
— |
— |
0.02 |
0.46 |
|||||||
|
Acceleration of stock compensation expense due to executive officer resignation |
— |
0.04 |
— |
— |
— |
0.04 |
— |
|||||||
|
Allocation to unvested restricted stock awards |
— |
(0.01) |
— |
(0.02) |
(0.01) |
(0.03) |
0.01 |
|||||||
|
Funds from operations per share attributable to Alexandria’s common |
$ 2.14 |
$ 2.13 |
$ 2.10 |
$ 2.05 |
$ 1.97 |
$ 8.42 |
$ 7.76 |
|||||||
|
Weighted-average shares of common stock outstanding for calculation of: |
||||||||||||||
|
Earnings per share – diluted |
165,393 |
161,554 |
161,412 |
158,198 |
154,307 |
161,659 |
147,460 |
|||||||
|
Funds from operations, diluted, per share |
165,393 |
161,554 |
161,412 |
158,209 |
154,307 |
161,659 |
147,460 |
|||||||
|
Funds from operations, diluted, as adjusted, per share |
165,393 |
161,554 |
161,412 |
158,209 |
154,307 |
161,659 |
147,460 |
|||||||
The full content of this article is only available to paid subscribers. If you are an active subscriber, please log in. To subscribe, please click here: SUBSCRIBE