Some you might expect, others you might not, RevistaMed data shows
By John B. Mugford

The average occupancy rate in the top 50 markets rose to 92.8% in Q4, up about 160 basis points from the end of 2021. (HREI photo)
On Jan. 24, HREI reported on the latest national healthcare real estate (HRE) statistics as compiled and presented by Arnold-based Revista during a webcast for its subscribers to recap the fourth quarter (Q4) and all of 2023.
The headline grabber of those stats showed that medical office building (MOB) sales were down significantly, falling to $1.4 billion in Q4 and $7.6 billion for all of 2023, marking the lowest quarterly and yearly totals since 2016. Both the Q4 and year-end MOB volume should be adjusted upward in the coming weeks, however, as more transactions are perhaps uncovered and tallied by Revista’s researchers.
Other information from the research firm’s RevistaMed HRE database indicated that the number of loans for MOBs slowed during much of 2023, when interest rates rose significantly and debt was more difficult to obtain, and that prices for MOBs had decreased, with the capitalization (cap) rate rising to 6.9 percent (trailing 12-month) in Q4, which was up about 80 basis points from a year earlier.
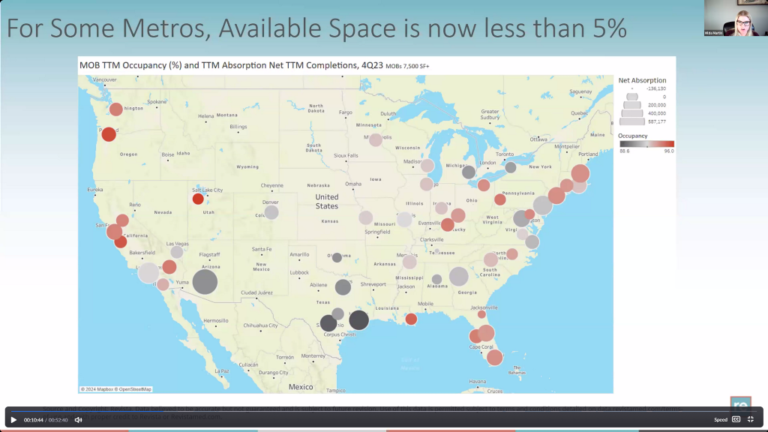
This week, following up on that national data, we delve into specific geographic markets highlighted during Revista’s Jan. 18 webcast, hosted by Principals Hilda Martin and Mike Hargrave. We explore market-specific data on MOB occupancy rates, space absorption, rental rate growth, and construction and sales activity.
Perhaps the market showing the most growth, in terms of both overall population and demand for MOB space, is
The full content of this article is only available to paid subscribers. If you are an active subscriber, please log in. To subscribe, please click here: SUBSCRIBE


