


In its subscriber webcast, RevistaMed data shows that occupancy, absorption remain high
By John B. Mugford
After four straight quarters of seeing the median cap rate for MOBs below 6 percent on a trailing 12-month (TTM) basis, Revista found that the median cap rate in Q3 was right at 6 percent (TTM). (Slide courtesy of Revista)
A recession is likely looming (if it’s not already upon us), difficulties in obtaining debt could be slowing down the sales of medical office buildings (MOBs), and rising costs, supply chain difficulties and labor shortages might be causing delays in the completions of healthcare real estate (HRE) construction projects. But the fundamentals of the HRE sector remain as strong as ever.
That familiar – albeit welcome – refrain regarding the state of the recession-resistant MOB and HRE sectors was heard once again during Revista’s most recent quarterly subscriber webcast, which was held Oct. 27. Executives of the Arnold, Md.-based HRE research firm reiterated that message as they shared data from the third quarter (Q3) of this year.
“There is so much going on right now … what with continuing rising inflation, continuing hiking of interest rates, a recession possibly on the horizon … the fundamentals of the property type remain remarkably strong,” said Hilda Martin, who along with fellow Revista principal Mike Hargrave hosted the webcast and presented a wide range of Q3 HRE data.
Based on data from the firm’s RevistaMed database, the first slide of the presentation showed that the MOB occupancy rate in the country’s top 50 markets stood at 92 percent in Q3 on a trailing 12-month (TTM) basis, the highest rate in the past 15 quarters. The reason for that is the strong demand for MOB space in those markets, as there was 18.1 million square feet of space absorbed in Q3 (TTM), also the highest total in the past 15 quarters, according to RevistaMed data.
On top of that, year-over-year triple-net rent growth stood at 2.1 percent as of Q3, the second highest rate in the past 15 quarters.
Making an appearance on the webcast was Collin Hart, CEO and managing partner of Irvine, Calif.-based ERE Healthcare Real Estate Advisors. ERE is an HRE-focused real estate brokerage firm with four main offices nationwide that says it specializes in representing “physician groups in structuring sale and leaseback transactions on their clinical and surgical center real estate. We function as a conduit between physician partnerships and institutional real estate investors.”
At various times during the presentation, Mr. Hart was asked to provide insight into what he and his colleagues are seeing in the market.
For example, later in the presentation as pricing was discussed, Mr. Hart presented data compiled by ERE showing the spread between the average interest rate at which investors are borrowing – based on the Federal Reserve’s target interest rate – and the average capitalization (cap) rate at which they are buying MOBs. That gap has narrowed significantly in the past year, he pointed out, falling from a spread of about 635 basis points (bps) to about 265 bps currently.
The fact that deals are still getting done at the lowered gap, is “testament to the relationships in the space,” Mr. Hart said. “Certainly, there have been some deals that have blown up, but, overall, the market has been willing to accept a lower spread and a lower rate of return to honor their deals and honor the transactions.”
As for MOB sales, the volume during the past 12 months – $29.4 billion – was a new high-water mark for a 12-month span, according to Mr. Hargrave. “That did set an all-time record, but it does include the approximately $10 billion of MOB sales that took place as part of the HR-HTA merger,” which saw Healthcare Trust of America (HTA) and its 24 million square foot MOB portfolio be acquired by Nashville, Tenn.-based Healthcare Realty Trust Inc. (NYSE: HR).
Mr. Hargrave also noted that – as was to be expected during a period of rising interest rates and more-difficult-to-obtain debt – that the MOB sales volume in Q3 was somewhat sluggish at $2.6 billion, the lowest quarterly total since the $2.1 billion of sales volume posted in Q1 2021.
“The Q3 volume was lower than a year earlier, in Q3 2021, when sales were $5.8 billion, which was a very strong quarter, but (was) more in line with the volume in Q3 2020 ($2.3 billion),” he noted. “And our sales volume for Q3 is still preliminary, as we are still tracking deals that closed as the quarter came to a close. We often add a significant amount of volume after a quarter closes as we find more deals.”
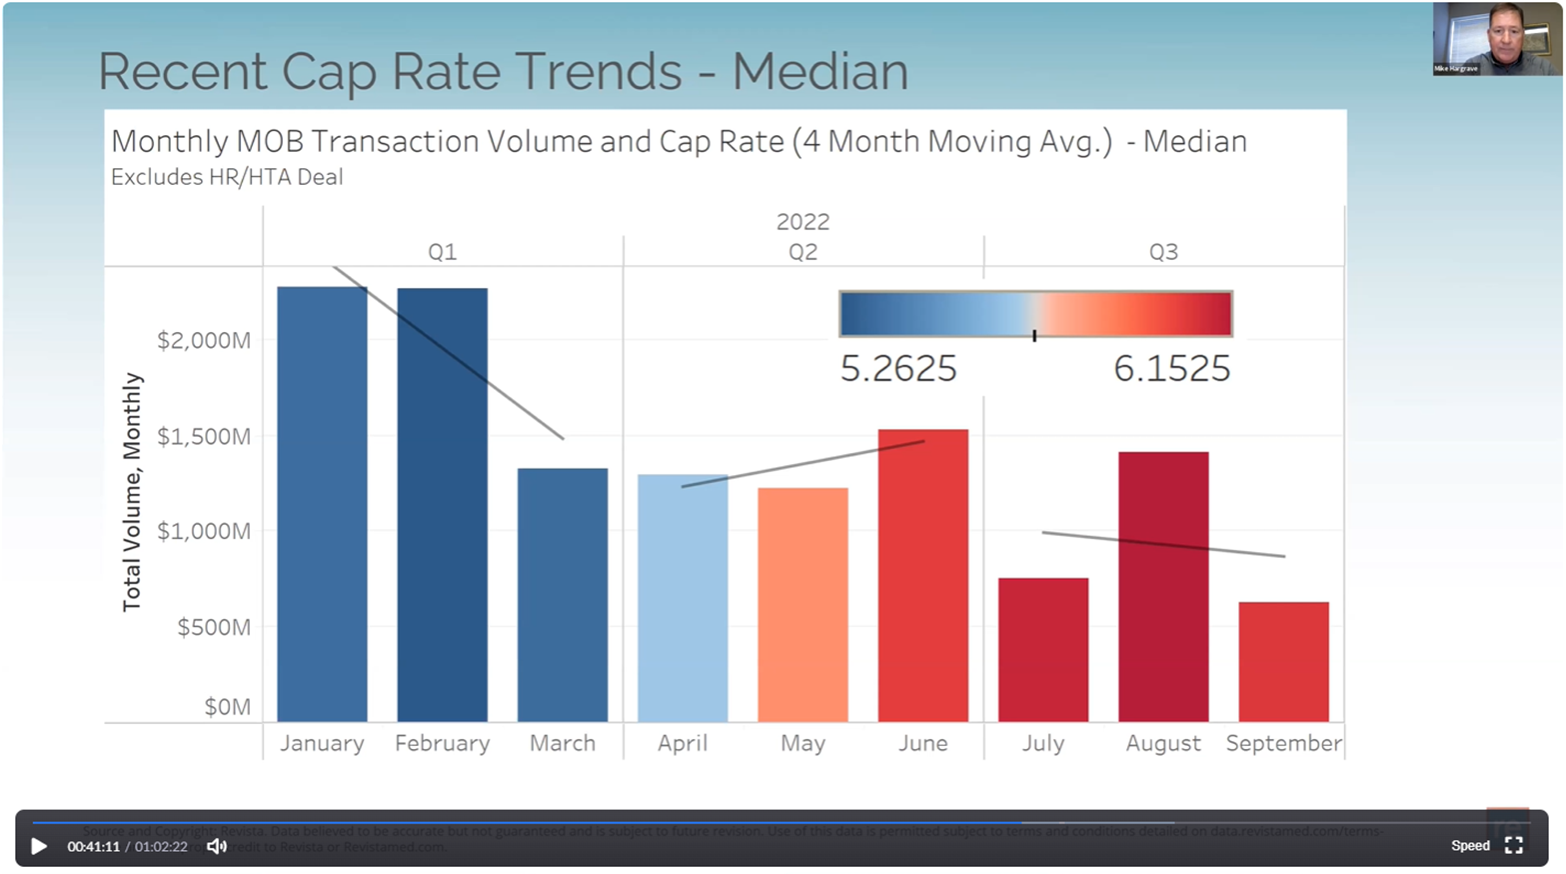
Mr. Hargrave showed a chart indicating the MOB sales volume on a monthly basis, which shows that sales are “materially slowing down” in recent months. According to the data, the MOB monthly sales volume topped $2 billion in both January and February of 2022, but by July had slowed to about $750 million.
The monthly volume is slowing “materially,” Mr. Hargrave noted. The slide shows sales falling to about $600 million in September, though those figures are still somewhat preliminary.
Cap rates on the rise
As for pricing of MOB deals, Revista’s data shows that cap rates are indeed, and finally, starting to ease up as debt prices continue to rise along with inflation and interest rates.
It should be noted that in order to reflect what is truly taking place in the market, Revista did not include data from the HR-HTA deal, because “if we included that in our data we would still see cap rates compressing through the third quarter, and that is not the case for the rest of the market.”
After four straight quarters of seeing the median cap rate for MOBs below 6 percent on a TTM basis, the median cap rate in Q3 was right at 6 percent (TTM). The lower 25th percentile of deals, which Mr. Hargrave describes as typically being value-add transactions, had an average cap rate of 6.7 percent (TTM), up from the 6.5 and 6.1 percent cap rates posted in the past two quarters.
As for the higher-priced, near-trophy deals – those Revista considers to be in the upper 75th percentile – there “was some resistance” to cap rate compression, according to Mr. Hargrave. The average cap rates in that category were at 5.3 percent in Q3 (TTM), which was in keeping with the average cap of between 5.2 percent and 5.3 percent during the past seven quarters.
Cap rates have risen somewhat substantially for the highest priced, trophy deals, most of which take place in the most expensive real estate markets such as Los Angeles or New York. According to RevistaMed data, the average cap rate for such deals rose to 4 percent (TTM) in Q3 from 3.4 percent in Q1 of this year, an increase of about 18 percent in only two quarters.
In presenting pricing data that is more timely than for the TTM, Mr. Hargrave showed a slide indicating that the median cap rate for MOB deals, on a trailing four-month basis, rose to 6.15 percent in August of this year from about 5.26 percent in January and February.
“So that’s up about 90 basis points in that short period of time,” he said.
In the lower 25th percentile of transactions, or value-add deals, the average cap rate on a trailing four-month basis rose to about 6.85 percent in August from about 5.9 percent in February – a increase of more than 90 basis points.
In the upper 75th percentile of deals, the average cap rate on a trailing four-month basis rose about 50 basis points from the first couple of months to the September-August timeframe, coming in at 5.5 percent in the most recent period.
“What we’ve seen is that cap rates have moved quite substantially just this year,” Mr. Hargrave said, “rising anywhere from 50 to 100 basis points depending on the type of asset trading.”
Although many health systems continue to move services to off-campus locations, and investors indicate that they are interested in off-campus MOBs, RevistaMed data indicates that on-campus facilities continue to garner significantly lower cap rates than off-campus facilities.
“There’s a distinct different between the two,” Mr. Hargrave said, as “78 percent of the on-campus MOBs that traded in the past year did so at a cap rate of under 5 percent. As for off-campus deals, those cap rates had a much wider range.”
Although published cap rates are typically slow to reflect what is actually taking place in the market, the people tuning in to the Revista webcast believe cap rates will continue to rise in coming months.
In a poll conducted during the presentation, 53 percent of the viewers said they believe MOB cap rates will increase by 100 to 200 basis points in the somewhat near future, while 37 percent said they believe cap rates will increase by 10 to 100 basis points.
When it was shown that 4 percent of the viewers believe cap rates will stay at or near current levels, Mr. Hart joked that those “folks” should give him a call, as he has some “properties to show them.”
As to whether lenders plan to tighten their criteria in the MOB sector, a recent Revista poll – not taken during the webcast – indicated that of the five to 10 entities to respond, 90 percent said they plan to indeed “tighten their lending criteria,” while 10 percent said they do not intend to do so. Those that responded indicated that they believe the “overall loan volume” in the sector will be lower than in the previous 12-month timeframe.
“I would add that the default rate for MOBs, well we’ve had no defaults,” Mr. Hart noted. “Sure, a lot of prospective buyers have become more discerning in making acquisitions as interest rates rise, but that doesn’t mean that deals aren’t getting done. Buyers who still want to invest in a strong asset class are still doing deals, and we appreciate that they do what they say they will do.”
Construction remains strong, for now
Revista’s basic MOB construction data, which comprises three categories – the number of square feet started, completed and in the pipeline – indicates that the amount of construction started, despite economic headwinds, has not slowed down.
“In fact, we’re not seeing a slowdown in the number of projects started at all,” Mr. Hargrave said. “In fact, in September, we saw 7.5 million square feet of new construction projects started. That indicates that there has yet to be any negative impact on construction resulting from the financial markets – though that might still happen at some point.”
As for the number of projects started on a TTM basis as of Q3, that number was 27.1 million square feet, the highest quarterly number on a rolling 12-month basis recorded by Revista, whose MOB construction data goes back to Q1 2016.
Despite such a high number of projects started, just 18.7 million square feet of space was completed during the past 12 months as of Q3.
That means the amount of new MOB space in the pipeline is as high as ever, at 50.2 million square feet (TTM).
“Completions are not yet rising,” Mr. Hargrave said. “I would expect that 18.7 million square feet of completions over the last year to start rising from current levels. Obviously, we have a pretty full pipeline of construction projects and they’re due to move to completions in the next couple of quarters or so.”
Of the 50.2 million square feet of MOB projects in the pipeline, more than 60 percent of that, or about 32 million square feet, is in the country’s top 50 markets. Houston and New York currently have the largest pipelines, at 2.1 million square feet and 2 million square feet, respectively.
As for hospital construction, the number of projects and square footage underway are on the rise, according to RevistaMed data.
As of Q3, there were a total of 420 projects comprising expansions, new facilities and/or replacement facilities under construction – a strong increase from the 372 projects underway as of a year ago in Q3 2021.
The projects underway in Q3 2022 have a total of 96.8 million square feet of space and a total value of $81.7 billion.
“Hospital construction is up over 2021,” Mr. Hargrave said, noting that there are currently “113 brand new hospital projects under construction. That’s quite a rise over the 92 new hospitals under construction in Q3 2021.”
Other topics covered
During the hour-long presentation, a number of other topics were covered, including:
■ In an indication that a recession is likely, Mr. Hargrave showed a slide indicating that the current “Two-Year Treasury is yielding about 30 basis points more than the 10-year Treasury, so it’s currently inverted and has been inverted since July of this year,” he said. “If you look backwards on this chart (which dates back to the 1970s), you’ll see that there are several instances of this inversion, and each time that’s happened, on this chart at least, a recession has followed several months later. So, we’ll see what happens here… A lot of this is definitely affecting the lending environment and the sales activity in terms of uncertainty.”
■ Although the absorption of MOB space in the top 50 markets over a 12-month period has increased significantly in recent quarters, rising from just 8.5 million square feet of space three years ago – in Q3 2019 – to 18.1 million square feet in Q3 2022, Ms. Martin noted that with many MOB projects being completed in coming quarters, “we will be watching closely to see if that continues.” When asked whether Mr. Hart sees the strong absorption and occupancy numbers make investors even more interested in MOBs, he said “we certainly do. We saw this take place during and after COVID-19, there was even more demand for healthcare real estate because of how stable it is and because you get your rent payments. If you owned apartments, you couldn’t kick people out of their apartments for not paying their rents, and retail had a hard time. All of this just solidified the demand for healthcare real estate.”
■ With inflation and pricing on the rise and reimbursement payments to providers not keeping up with that pace, more and more physicians are joining health systems or corporate entities, such as private equity owned practices. Ms. Martin showed information indicating that just in the past three years or so, the number of employed physicians has risen from 62.2 percent in January of 2019 to 73.9 percent in January of 2022. Having prices rise while not receiving an increase in payments is “harder on smaller groups and independent physicians,” Ms. Martin said, “as they do not have the economies of scale as health systems or the larger groups.”
■ As a result of more physicians leaving independent practices to join health systems or groups backed by private equity (PE) firms, Mr. Hart said, an increasing number of physicians are looking to sell their real estate in sale-leaseback transactions. “What’s happening with a lot of these physician practices, is that 20 years ago there was a succession plan where younger docs would take over a practice as the older docs retired,” he said. However, as a rising number of younger doctors continue to join health systems or PE-backed groups, there are fewer physicians within a practice for the older, retiring doctors to sell to, Mr. Hart said. It’s why many of the older doctors are also joining larger entities themselves. “And when it comes to the real estate, years ago the doctors owning the properties would also sell their shares in the building to the incoming partners,” he said. “But without those incoming partners to sell to today, this is driving a lot of real estate deals. It’s more complicated than just saying they have no one else to sell their buildings to, as there is still strong demand for such facilities, but it is driving transactions nonetheless.”
The full content of this article is only available to paid subscribers. If you are an active subscriber, please log in. To subscribe, please click here: SUBSCRIBE