


Revista unveils new service and reports on inventories, construction and rents at inaugural event in Boston
By Murray W. Wolf
During its RevistaLab LSRE Investment Forum, an educational and networking event that took place at the Encore Boston Harbor Oct. 13-14, Revista shared a wide range of data, including information on inventory, construction and rents. (Slide courtesy of Revista)
It’s usually a strong indication that a commercial real estate sector has “arrived” when there’s enough interest in the market for it to give rise to its own dedicated news media and data services. If those are the benchmarks, life science real estate (LSRE) is indeed here to stay.
First there was this publication, Bioscience Real Estate Insights (BREI), which was launched in August and has already far exceeded our expectations in terms of subscribers and reader engagement. And now there’s RevistaLab, a new LSRE data service, which made its debut last Thursday and Friday, Oct. 13-14, with the first-ever RevistaLab LSRE Investment Forum, an educational and networking event that took place at the Encore Boston Harbor.
Arnold, Md.-based Revista, whose RevistaMed has emerged as the most prominent data service for the healthcare real estate (HRE) space, hopes to emulate that success in the LSRE sector with RevistaLab.
For its RevistaMed service, Revista Founders and Principals Elisa Freeman, Hilda Flower Martin and Mike Hargrave like to say that “the difference is the data,” so it was not surprising that the data also took center stage at the inaugural RevistaLab event.
Ms. Martin and Mr. Hargrave kicked off the two-day conference Thursday afternoon with a presentation titled “The State of the Life Science Markets Part 1: Bioscience Real Estate by the Numbers,” which gave the audience perhaps the most detailed data ever available regarding the LSRE market.
“I’m so excited to be building something from the ground up, and to be in this sector, life sciences real estate, is very exciting,” Ms. Martin began. “It’s a very entrepreneurial sector.”
She commenced her part of the presentation acknowledging the widely reported fact that although venture capital (VC) funding of life sciences has declined this year, it remains near its historic highs.
“We all know that since the pandemic, there has been money flooding into the life sciences,” she said. “Twenty-twenty-one was astronomical, with $30-some-odd billion of just venture capital funding coming into the sector – way more than any amount we’d seen prior to that time.
“Now, this year, we’ve seen a little bit of a pullback, as it has come down off of those highs, as there is some overall market instability and it’s come down a little since Q4 (the fourth quarter) of last year. But, the question is: How much could it have kept going up from those incredible high points of funding?”
Noting that VC funding for life sciences was already on the rise prior to the pandemic, she continued, “What I would say is that we are in a growth phase, even without the pandemic.” Noting that “incredible” technological advances have been driving the growth of the industry, she added, “This is an incredible time.”
Ms. Martin shared a chart that showed how life sciences employment has grown rapidly since 2001, including a sharp uptick in the trend line since 2018.
“So this hockey stick is going up and these employees, unlike in a lot of other sectors, are not as affected by the telework-telecommute movement. If you’re in life sciences and research and manufacturing, you can’t necessarily work from home, and this growing life sciences employment trend translates into a big need for space.”
“So as we look at 2022, everything is sort of in flux right now, as you know,” she said. “But there was a survey done at the end of last year, so in December 2021, by Aon, an HR (human resources) data company, and they do a survey of life sciences companies, and 71 percent responded that they plan to increase their workforce in the near term. Over a third said that they plan to increase their workforce more than 15 percent in the near term.”
Of course, with this year’s decline in VC funding, as well as falling valuations for public companies, a number of life sciences firms have shelved expansion plans or even begun laying off employees, which Ms. Martin acknowledged.
“So, yes, we need to be a little more cautious as there is a little bit less money coming into the sector, but the demand has been huge for space,” she said.
Although VC funding might have declined, she pointed out that major life sciences clusters continue to attract billions of dollars in funding from National Institutes of Health (NIH), the primary U.S. government agency responsible for biomedical and public health research.
Noting established life sciences clusters tend to attract more NIH funding, and an even larger proportion of VC funding, Ms. Martin asked the question: “What makes up a good life sciences cluster?
“You need good access to entrepreneurs, an ecosystem of startups that feed off of each other and anchors that consist of top-tier universities. And of course, access to funding.
“So, the overall market continues to be – even though we do have some up-and-coming clusters around the country – very focused and localized in particular areas, namely the major clusters.”
Ms. Martin then shared an example of RevistaLab’s property search database tool, adding, “We just launched this today.”
In the coming months, Revista plans to compile a nationwide database of LSRE data. So far, it has compiled data for the three largest life science clusters: Boston-Cambridge, Mass.; the San Francisco Bay Area; and the San Diego area.
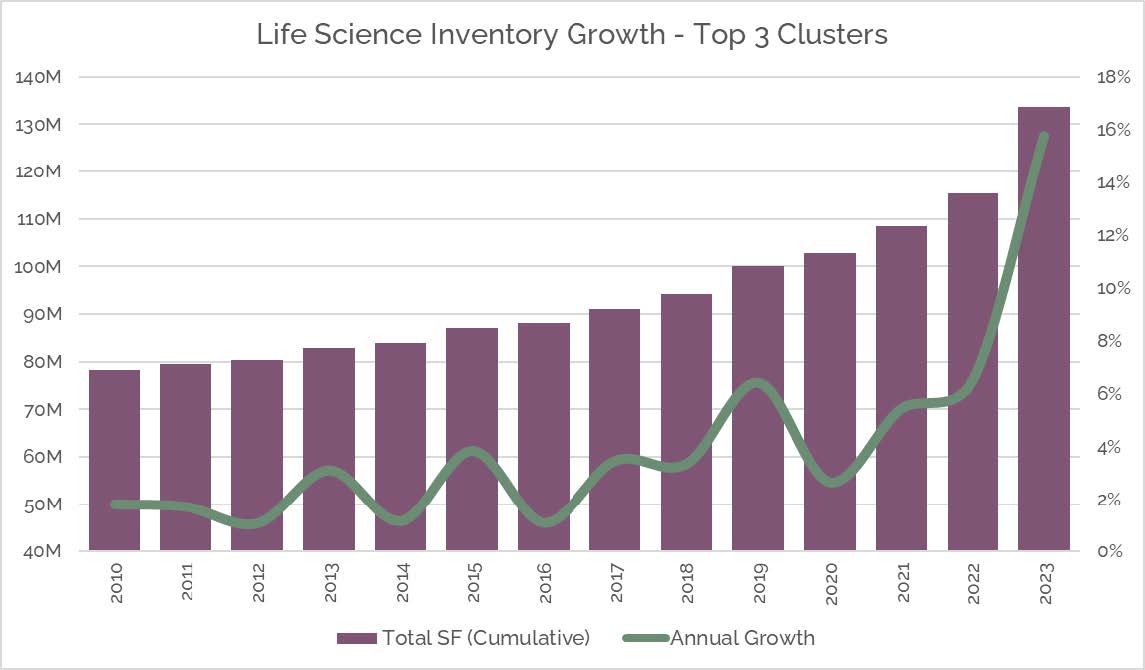
Demand far exceeds supply
“Let’s talk about that inventory growth,” Ms. Martin said. Revista has created what it calls a “Life Science Real Estate Supply vs. Demand Index,” which uses the year 2012 as its baseline of 1,000. The demand part of the equation is NIH and VC funding growth, and the supply component is total inventory growth.
On that basis, in the three largest clusters, supply outpaced demand through 2017. But demand has far outpaced supply since 2018, peaking at a 2,134 index during the COVID-fueled, record VC funding year of 2021. Ms. Martin noted that the index for 2022 is 1,762, but that doesn’t include not-yet-available fourth quarter (Q4) VC funding data, which should drive the index even higher, although “it’s very likely going to be beneath last year.”
Even so, the upshot is that demand growth for life sciences space in the top three clusters was more than double the growth in supply in 2021, and will probably be within shouting distance of doubling again this year.
“And construction – it’s not instant, it’s going to lag,” she added. “All this excess demand we’ve been having these last few years, it takes a while for that catch up and it’s just starting to this year. In 2022, we will end the year with about 150 million square feet and clearing 6 percent in inventory growth. Next year – and this is based on stuff that’s currently under construction for the most part – we could be up 16 percent or more in terms of inventory growth, and some of that might get delayed into ‘24. We’re looking at a pretty big chunk.”
She added, “Now there could be some level of growing pains here. It really depends market to market,” noting that some planned projects that aren’t 100 pre-leased might be delayed or put on hold.
Ms. Martin also reminded the audience that at this point the RevistaLab data includes only the three largest clusters. “So once we go beyond that, to some of the other ones, this may change slightly.”
She also pointed out a significant difference between the HRE and LSRE markets. She noted that in the HRE side, most of inventory is owned by the users, whereas most LSRE is owned by private equity and real estate investment trusts (REITs). She said that 79 percent of LSRE in the top three markets is owned by REITs (46 percent) and private investors (33 percent), and only 21 percent by life sciences firms.
“So you’re not seeing a whole lot of sale-leaseback activity,” she pointed out, “although, it does happen.” A lot of (transactions are) investor to investor, and I would imagine that when a lot of this inventory comes to market a few years down the line, we’ll start to see (transaction volume) pick up as well.”
Drilling down into the data
Mr. Hargrave then took the stage to share more detailed data from the RevistaLab database regarding the three largest life sciences clusters.
He noted that LSRE inventory in the Boston, San Francisco and San Diego Core-Based Statistical Areas (CBSAs) totaled 948 properties and 119.1 million square feet through the end of Q3. He noted that the Boston market comprised “about half “of the total, with 61 million square feet.
Mr. Hargrave said that Revista has also compiled rental rate information from a variety of sources, including U.S. Securities and Exchange Commission (SEC), as well as other public disclosures. The data includes current in-place rents as well as average current escalations on in-place rents.
The Boston-Cambridge market led the way with an average current in-place rental rate of $64.27 per square foot (PSF). San Francsico and San Diego came in at $52.69 and $44.58, respectively. San Francisco led the way in average current rent escalations at 3.3 percent, followed by San Diego (3.2 percent) and Boston (2.9 percent).
Construction in the pipeline is “robust,” Mr. Hargrave said, with a total of 372 projects totaling 113.2 million square feet planned or in progress in the three largest clusters, with a total value of $96.7 billion.
With an existing inventory of 119.1 million square feet in the three largest clusters, he noted that the inventory would almost double if all the construction projects in the pipeline come to fruition.
“A little more than half of that construction is targeting the Boston market – 61 million square feet, over 200 properties,” he noted. Of that, 80 projects totaling 20.8 million square feet are in progress. About one third of the announced projects in the San Diego market are under way, and about one quarter of the Bay Area projects.
Reality check
Of course, the big question is: Given the current state of the economy, how many of the announced LSRE construction projects are actually likely to be completed in the next two years?
Mr. Hargrave said Revista keeps close tabs on project progress by communicating with local planning offices on a regular basis. Based on that real-time data, along with SEC filings and other sources, the firm projects that 46.4 million square feet on life sciences space will be completed through the end of 2024, “which is a significant growth in inventory that based off of 2021 numbers.”
That would represent a 42 percent increase in total inventory among the three largest clusters, compared with the 113.2 million square feet of projects said to be in the construction pipeline.
Mr. Hargrave then touched on average pre-leasing levels for construction projects slated to be completed during the next two years. Across the three largest clusters, pre-leasing averaged 81 percent for projects scheduled to deliver in 2022. It was 49.9 percent for 2023 projects and 31.5 percent for 2024 projects.
“When we move into 2023, obviously, we’re a little bit less than half of pre-leased right now, which, you know, really is pretty strong, I think, considering that those projects are often a year away from completing, leases can get completed by that,” he said.
Boston highlights
Mr. Hargrave then treated the hometown audience to more detailed data regarding the Boston-Cambridge market.
As previously noted, total LSRE inventory in the space has risen steadily during the past two decades to 61 million square feet this year compared with 31.5 million square feet in 2000.
“Boston’s market has doubled really since the year 2000 and it’s in line to double again if all the construction in the pipeline delivers,” he noted.
The total of 61 million square feet of inventory is mostly in the Route 128 sub-market (20.4 million square feet), Cambridge (20 million square feet) and Boston (12.6 million square feet), with another 8 million square feet in the Route 495 sub-market and the “Urban Edge.”
Total construction in progress more or less mirrors those inventory numbers, with the bulk of total construction – 17.7 million of the total of 20.8 million square feet, taking place in the Boston, Route 128 and Cambridge sub-markets.
Referring to a slide, he noted, “You can see that the Boston-Fenway-Seaport area has 7.2 million square feet (in progress). That’s a high level of construction compared to current inventory. You can see the Route 128 area also has a pretty high level of current construction, Cambridge a little bit lower than Route 128 in Boston, as far as underway right now.
“And then, the Urban Edge is really the market on a percentage basis that’s supposed to really grow the most over the next several years. It’s got, we’re tracking 11 projects there and 3 million square feet under construction right now.”
Mr. Hargrave then went on to discuss Boston-Cambridge area rental rates and some recent transactions, before a lively question and answer session with the audience.
For more information about the RevistaLab LSRE data service and future events, please click here. ❏
The full content of this article is only available to paid subscribers. If you are an active subscriber, please log in. To subscribe, please click here: SUBSCRIBE