


Normalized FFO of $0.41 Per Diluted Share
Same-Property Cash NOI Growth of 2.3%, 3.2% Excluding Forest Park Properties
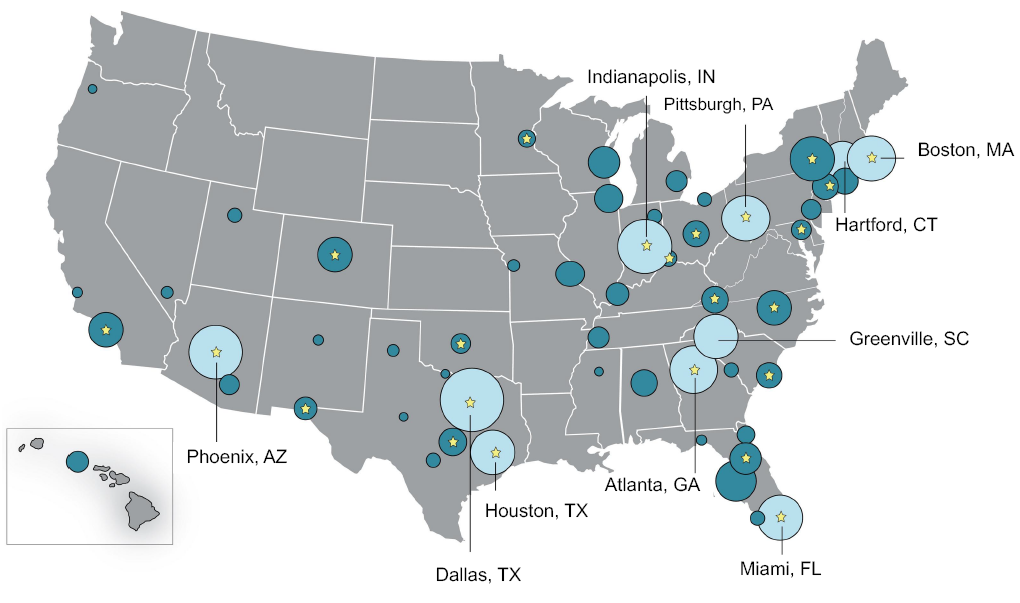
New Development Announced
SCOTTSDALE, Ariz., April 30, 2018 /PRNewswire/ — Healthcare Trust of America, Inc. (NYSE: HTA) (“HTA”) announced results for the three months ended March 31, 2018.
First Quarter 2018 Highlights
Operating
- Net Income Attributable to Common Stockholders: Decreased (27.6)% to $9.8 million, compared to Q1 2017. Earnings per diluted share decreased (44.4)% to $0.05 per diluted share, compared to Q1 2017. This decrease is primarily related to the increase in depreciation and amortization of $23.3 million as a result of the increase in the size of our investment portfolio.
- Funds From Operations (“FFO”): As defined by the National Association of Real Estate Investment Trusts (“NAREIT”), increased 40.5%, to $84.6 million, compared to Q1 2017. FFO per diluted share decreased (2.4)%, to $0.40 per diluted share, compared to Q1 2017.
- Normalized FFO: Increased 41.3%, to $85.0 million, compared to Q1 2017. Normalized FFO per diluted share remained stable at $0.41 per diluted share, compared to Q1 2017.
- Normalized Funds Available for Distribution (“FAD”): Increased 43.6%, to $75.9 million, compared to Q1 2017.
- Same-Property Cash Net Operating Income (“NOI”): Increased $1.8 million, or 2.3%, to $81.0 million, compared to Q1 2017. Excluding the MOBs located on its Forest Park campuses, Same-Property Cash NOI growth would have been 3.2%. This increase was driven by an increase of 1.5% in Same-Property rental revenue and an increase of 70 bps to 88.5% in Same-Property rental margins, measured as Same-Property Cash NOI divided by Same-Property rental revenue, compared to Q1 2017. From an occupancy perspective for the Same-Property pool, the leased rate increased 20 bps to 92.1% while the occupancy rate declined 10 bps to 91.0%, compared to Q1 2017.
Portfolio
- Leasing: HTA entered into new and renewal leases on approximately 663,000 square feet of GLA, or 2.7% of its portfolio. Tenant retention for the Same-Property portfolio was 81% by GLA for the quarter, which included approximately 609,000 square feet of GLA of total expiring leases. Releasing spreads for renewal leases on a cash basis were 2.7%. Renewal leases included tenant improvements of $1.07 per square foot of GLA per year of the lease term and approximately seven days of free rent per year of the lease term.
- Leased Rate: As of March 31, 2018, HTA had a leased rate for its portfolio of 91.8% by GLA and an occupancy rate of 90.7% by GLA.
- Forest Park Update: During the three months ended March 31, 2018, HTA entered into approximately 41,000 square feet of GLA of new leases on the former Forest Park Dallas campus. This leasing included approximately 37,000 square feet of GLA that is directly leased to the hospital.
- Development: Subsequent to March 31, 2018, HTA entered into a development agreement for a new MOB in the key gateway market of Miami, Florida. The state-of-the-art MOB will total approximately 51,000 square feet of GLA and be located adjacent to the Jackson South Hospital. Total development costs are estimated to be $21.8 millionand the building is expected to be 70% pre-leased to the hospital with construction expected to begin in 2019.
- Investments: During the quarter, HTA remained disciplined and strategically expanded within its key gateway markets. HTA invested $8.4 million to acquire an MOB of approximately 24,000 square feet of GLA in Raleigh, North Carolina, that was 100% leased as of the acquisition date to Duke Health System. In addition, HTA invested $3.9 million to consolidate its ownership interests in several MOBs.
- Dispositions: As of April 30, 2018, HTA has received letters of intent to sell multiple MOBs totaling an aggregate sales price of over $50 million. These properties are subject to customary closing conditions and no closings are assured.
2017 Investment Performance
- Cash NOI: During the three months ended March 31, 2018, HTA generated $34.5 million of Cash NOI on its 2017 investments, including its investment in its unconsolidated joint venture. This Cash NOI includes approximately $1.8 million of income from property management and building engineering services provided to its tenants. As of March 31, 2018, HTA’s run rate yield on its 2017 investments was approximately 5.2%, which included the full year impact of new leases that were signed but not yet occupied.
- Development: During the three months ended March 31, 2018, five of the seven acquired development properties were completed. The remaining two development properties, which are 100% pre-leased, are on track to be completed by the middle of 2018. As of the end of the quarter, the five development properties were 84% leased and generated $1.1 million of Cash NOI. HTA believes it is currently in the late stages of lease negotiations for an additional 26,000 square feet of GLA that would bring the leased rate on these development properties to 89% if completed. In total, the seven development properties are projected to generate between approximately $2.5 million and $2.8 million in quarterly Cash NOI upon completion and stabilization.
Balance Sheet
- Balance Sheet: As of March 31, 2018, HTA had total leverage of 33.0% measured as net debt (total debt less cash and cash equivalents) to total capitalization, and 5.9x measured as net debt to Adjusted Earnings before Interest, Taxes, Depreciation and Amortization for real estate (“Adjusted EBITDAre“). Total liquidity at the end of the quarter was $1.1 billion, including $994.5 million of availability under HTA’s unsecured revolving credit facility, $56.2 millionof cash and cash equivalents and a $75.0 million forward equity agreement, excluding anticipated costs to borrow.
Financial Results – First Quarter 2018
Rental Income
Rental income increased 41.6% to $175.6 million for the three months ended March 31, 2018, compared to $124.0 millionfor the three months ended March 31, 2017.
Net Income
Net income decreased (28.5)% to $10.0 million for the three months ended March 31, 2018, compared to $14.0 millionfor the three months ended March 31, 2017. This decrease is primarily related to the increase in depreciation and amortization of $23.3 million as a result of the increase in the size of our investment portfolio.
FFO
FFO, as defined by NAREIT, was $0.40 per diluted share, or $84.6 million, for the three months ended March 31, 2018, compared to $0.41 per diluted share, or $60.2 million, for the three months ended March 31, 2017.
Normalized FFO
Normalized FFO was $0.41 per diluted share, or $85.0 million, for the three months ended March 31, 2018, which remained stable compared to the three months ended March 31, 2017.
Normalized FAD
Normalized FAD increased 43.6% to $75.9 million, for the three months ended March 31, 2018, compared to $52.9 million for the three months ended March 31, 2017.
NOI
NOI increased 40.2% to $119.6 million for the three months ended March 31, 2018, compared to $85.3 million for the three months ended March 31, 2017.
Same-Property Cash NOI
Same-Property Cash NOI increased $1.8 million, or 2.3%, to $81.0 million, for the three months ended March 31, 2018, compared to $79.2 million for the three months ended March 31, 2017. Excluding the MOBs located on its Forest Parkcampuses, Same-Property Cash NOI growth would have been 3.2%.
General and Administrative Expenses
General and administrative expenses were $8.8 million for the three months ended March 31, 2018, compared to $8.4 million for the three months ended March 31, 2017.
Interest Expense
Total interest expense was $26.3 million for the three months ended March 31, 2018, compared to $16.4 million for the three months ended March 31, 2017.
Investment Activity
During the three months ended March 31, 2018, HTA invested $8.4 million to acquire an MOB of approximately 24,000 square feet of GLA in Raleigh, North Carolina, that was 100% leased as of the acquisition date to Duke Health System. In addition, HTA invested $3.9 million to consolidate its ownership interests in several MOBs.
Tenant Retention
Tenant retention for the Same-Property portfolio was 81% by GLA for the quarter, which included approximately 609,000 square feet of GLA of expiring leases.
About Healthcare Trust of America, Inc.
Healthcare Trust of America, Inc. (NYSE: HTA) is the largest dedicated owner and operator of medical office buildings in the United States, comprising over 24.1 million square feet of GLA, with over $7.0 billion invested primarily in medical office buildings. HTA provides real estate infrastructure for the integrated delivery of healthcare services in highly-desirable locations. Investments are targeted to build critical mass in 20 to 25 leading gateway markets that generally have leading university and medical institutions which translates to superior demographics, high-quality graduates, intellectual talent and job growth. The strategic markets HTA invests in support a strong, long-term demand for quality medical office space. HTA utilizes an integrated asset management platform consisting of on-site leasing, property management, engineering and building services, and development capabilities to create complete, state of the art facilities in each market. This drives efficiencies, strong tenant and health system relationships, and strategic partnerships that result in high levels of tenant retention, rental growth and long-term value creation. Headquartered in Scottsdale, Arizona, HTA has developed a national brand with dedicated relationships at the local level.
Founded in 2006 and listed on the New York Stock Exchange in 2012, HTA has produced attractive returns for its stockholders that have significantly outperformed the S&P 500 and US REIT indices. More information about HTA can be found on the Company’s Website, Facebook, LinkedIn and Twitter.
Forward-Looking Language
This press release contains certain forward-looking statements with respect to HTA. Forward-looking statements are statements that are not descriptions of historical facts and include statements regarding management’s intentions, beliefs, expectations, plans or predictions of the future, within the meaning of Section 27A of the Securities Act of 1933, as amended, and Section 21E of the Securities Exchange Act of 1934, as amended. Because such statements include risks, uncertainties and contingencies, actual results may differ materially and in adverse ways from those expressed or implied by such forward-looking statements. These risks, uncertainties and contingencies include, without limitation, the following: changes in economic conditions generally and the real estate market specifically; legislative and regulatory changes, including changes to laws governing the taxation of REITs and changes to laws governing the healthcare industry; the availability of capital; changes in interest rates; competition in the real estate industry; the supply and demand for operating properties in our proposed market areas; changes in accounting principles generally accepted in the United States of America; policies and guidelines applicable to REITs; the availability of properties to acquire; and the availability of financing. Additional information concerning us and our business, including additional factors that could materially and adversely affect our financial results, include, without limitation, the risks described under Part I, Item 1A – Risk Factors, in our 2017 Annual Report on Form 10-K and in our filings with the SEC.
Conference Call
HTA will host a conference call and webcast on Monday, April 30, 2018 at 11:00 a.m. Eastern Time (8:00 a.m. Pacific Time) to review its financial performance and operating results for the three months ended March 31, 2018.
Conference Call and Webcast Details:
Domestic Dial-In Number: (877) 507-6265
International Dial-In Number: (412) 902-6633
Canada Dial-In Number: (855) 669-9657
Webcast: www.htareit.com under the Investor Relations tab
Replay Conference Call Details:
Domestic Dial-In Number: (877) 344-7529
International Dial-In Number: (412) 317-0088
Canada Dial-In Number: (855) 669-9658
Conference ID: 10119251
Available April 30, 2018 (one hour after the end of the conference call) to May 30, 2018 at 11:00 a.m. Eastern Time (8:00 a.m. Pacific Time)
Supplemental Information
Supplemental financial data are available on the HTA’s website at www.htareit.com.
Financial Contact:
Robert A. Milligan, Chief Financial Officer
480.998.3478
| HEALTHCARE TRUST OF AMERICA, INC. | ||||||||
| CONDENSED CONSOLIDATED BALANCE SHEETS | ||||||||
| (In thousands, except for share and per share data) | ||||||||
| (Unaudited) | ||||||||
| March 31, 2018 | December 31, 2017 | |||||||
| ASSETS | ||||||||
| Real estate investments: | ||||||||
| Land | $ | 486,403 | $ | 485,319 | ||||
| Building and improvements | 5,851,437 | 5,830,824 | ||||||
| Lease intangibles | 638,103 | 639,199 | ||||||
| Construction in progress | 24,559 | 14,223 | ||||||
| 7,000,502 | 6,969,565 | |||||||
| Accumulated depreciation and amortization | (1,087,262) | (1,021,691) | ||||||
| Real estate investments, net | 5,913,240 | 5,947,874 | ||||||
| Investment in unconsolidated joint venture | 69,147 | 68,577 | ||||||
| Cash and cash equivalents | 56,243 | 100,356 | ||||||
| Restricted cash | 12,695 | 18,204 | ||||||
| Receivables and other assets, net | 203,686 | 207,857 | ||||||
| Other intangibles, net | 104,824 | 106,714 | ||||||
| Total assets | $ | 6,359,835 | $ | 6,449,582 | ||||
| LIABILITIES AND EQUITY | ||||||||
| Liabilities: | ||||||||
| Debt | $ | 2,780,291 | $ | 2,781,031 | ||||
| Accounts payable and accrued liabilities | 134,574 | 167,852 | ||||||
| Derivative financial instruments – interest rate swaps | 742 | 1,089 | ||||||
| Security deposits, prepaid rent and other liabilities | 59,530 | 61,222 | ||||||
| Intangible liabilities, net | 66,665 | 68,203 | ||||||
| Total liabilities | 3,041,802 | 3,079,397 | ||||||
| Commitments and contingencies | ||||||||
| Redeemable noncontrolling interests | 6,770 | 6,737 | ||||||
| Equity: | ||||||||
| Preferred stock, $0.01 par value; 200,000,000 shares authorized; none issued and outstanding | — | — | ||||||
| Class A common stock, $0.01 par value; 1,000,000,000 shares authorized; 205,179,776 and 204,892,118 shares issued and outstanding as of March 31, 2018 and December 31, 2017, respectively | 2,052 | 2,049 | ||||||
| Additional paid-in capital | 4,511,736 | 4,508,528 | ||||||
| Accumulated other comprehensive loss | 1,157 | 274 | ||||||
| Cumulative dividends in excess of earnings | (1,284,826) | (1,232,069) | ||||||
| Total stockholders’ equity | 3,230,119 | 3,278,782 | ||||||
| Noncontrolling interests | 81,144 | 84,666 | ||||||
| Total equity | 3,311,263 | 3,363,448 | ||||||
| Total liabilities and equity | $ | 6,359,835 | $ | 6,449,582 | ||||
| HEALTHCARE TRUST OF AMERICA, INC. | ||||||||
| CONDENSED CONSOLIDATED STATEMENTS OF OPERATIONS | ||||||||
| (In thousands, except per share data) | ||||||||
| (Unaudited) | ||||||||
| Three Months Ended March 31, | ||||||||
| 2018 | 2017 | |||||||
| Revenues: | ||||||||
| Rental income | $ | 175,567 | $ | 123,993 | ||||
| Interest and other operating income | 94 | 354 | ||||||
| Total revenues | 175,661 | 124,347 | ||||||
| Expenses: | ||||||||
| Rental | 56,022 | 39,020 | ||||||
| General and administrative | 8,786 | 8,423 | ||||||
| Transaction | 191 | 284 | ||||||
| Depreciation and amortization | 70,392 | 47,056 | ||||||
| Impairment | 4,606 | — | ||||||
| Total expenses | 139,997 | 94,783 | ||||||
| Income before other income (expense) | 35,664 | 29,564 | ||||||
| Interest expense: | ||||||||
| Interest related to derivative financial instruments | (58) | (324) | ||||||
| Gain on change in fair value of derivative financial instruments, net | — | 839 | ||||||
| Total interest related to derivative financial instruments, including net change in fair value of derivative financial instruments | (58) | 515 | ||||||
| Interest related to debt | (26,195) | (16,058) | ||||||
| Gain on sale of real estate, net | — | 3 | ||||||
| Loss on extinguishment of debt, net | — | (32) | ||||||
| Income from unconsolidated joint venture | 570 | — | ||||||
| Other income | 35 | 8 | ||||||
| Net income | $ | 10,016 | $ | 14,000 | ||||
| Net income attributable to noncontrolling interests | (214) | (455) | ||||||
| Net income attributable to common stockholders | $ | 9,802 | $ | 13,545 | ||||
| Earnings per common share – basic: | ||||||||
| Net income attributable to common stockholders | $ | 0.05 | $ | 0.10 | ||||
| Earnings per common share – diluted: | ||||||||
| Net income attributable to common stockholders | $ | 0.05 | $ | 0.09 | ||||
| Weighted average common shares outstanding: | ||||||||
| Basic | 205,069 | 141,780 | ||||||
| Diluted | 209,177 | 146,117 | ||||||
| HEALTHCARE TRUST OF AMERICA, INC. | |||||||||||||
| CONDENSED CONSOLIDATED STATEMENTS OF CASH FLOWS | |||||||||||||
| (In thousands) | |||||||||||||
| (Unaudited) | |||||||||||||
| Three Months Ended March 31, | |||||||||||||
| 2018 | 2017 | ||||||||||||
| Cash flows from operating activities: | |||||||||||||
| Net income | $ | 10,016 | $ | 14,000 | |||||||||
| Adjustments to reconcile net income to net cash provided by operating activities: | |||||||||||||
| Depreciation, amortization and other | 68,303 | 46,213 | |||||||||||
| Share-based compensation expense | 3,507 | 2,530 | |||||||||||
| Bad debt expense | 3 | 103 | |||||||||||
| Impairment | 4,606 | — | |||||||||||
| Income from unconsolidated joint venture | (570) | — | |||||||||||
| Gain on sale of real estate, net | — | (3) | |||||||||||
| Loss on extinguishment of debt, net | — | 32 | |||||||||||
| Change in fair value of derivative financial instruments | — | (839) | |||||||||||
| Changes in operating assets and liabilities: | |||||||||||||
| Receivables and other assets, net | 9,274 | (7,771) | |||||||||||
| Accounts payable and accrued liabilities | (30,780) | (7,934) | |||||||||||
| Prepaid rent and other liabilities | (3,479) | 682 | |||||||||||
| Net cash provided by operating activities | 60,880 | 47,013 | |||||||||||
| Cash flows from investing activities: | |||||||||||||
| Investments in real estate | (11,887) | (34,706) | |||||||||||
| Development of real estate | (13,235) | — | |||||||||||
| Proceeds from the sale of real estate | — | 4,746 | |||||||||||
| Capital expenditures | (17,417) | (12,894) | |||||||||||
| Collection of real estate notes receivable | 172 | — | |||||||||||
| Net cash used in investing activities | (42,367) | (42,854) | |||||||||||
| Cash flows from financing activities: | |||||||||||||
| Borrowings on unsecured revolving credit facility | — | 92,000 | |||||||||||
| Payments on unsecured revolving credit facility | — | (10,000) | |||||||||||
| Payments on secured mortgage loans | (1,598) | (40,155) | |||||||||||
| Security deposits | 52 | 14 | |||||||||||
| Repurchase and cancellation of common stock | (2,709) | (3,118) | |||||||||||
| Dividends paid | (62,546) | (42,536) | |||||||||||
| Distributions paid to noncontrolling interest of limited partners | (1,334) | (1,332) | |||||||||||
| Net cash used in financing activities | (68,135) | (5,127) | |||||||||||
| Net change in cash, cash equivalents and restricted cash | (49,622) | (968) | |||||||||||
| Cash, cash equivalents and restricted cash – beginning of period | 118,560 | 25,045 | |||||||||||
| Cash, cash equivalents and restricted cash – end of period | $ | 68,938 | $ | 24,077 | |||||||||
| HEALTHCARE TRUST OF AMERICA, INC. | |||||||||||||
| NOI, CASH NOI AND SAME-PROPERTY CASH NOI | |||||||||||||
| (In thousands) | |||||||||||||
| (Unaudited) | |||||||||||||
| Three Months Ended March 31, | |||||||||||||
| 2018 | 2017 | ||||||||||||
| Net income | $ | 10,016 | $ | 14,000 | |||||||||
| General and administrative expenses | 8,786 | 8,423 | |||||||||||
| Transaction expenses | 191 | 284 | |||||||||||
| Depreciation and amortization expense | 70,392 | 47,056 | |||||||||||
| Impairment | 4,606 | — | |||||||||||
| Interest expense and net change in fair value of derivative financial instruments | 26,253 | 15,543 | |||||||||||
| Gain on sale of real estate, net | — | (3) | |||||||||||
| Loss on extinguishment of debt, net | — | 32 | |||||||||||
| Income from unconsolidated joint venture | (570) | — | |||||||||||
| Other income | (35) | (8) | |||||||||||
| NOI | $ | 119,639 | $ | 85,327 | |||||||||
| NOI percentage growth | 40.2 | % | |||||||||||
| NOI | $ | 119,639 | $ | 85,327 | |||||||||
| Straight-line rent adjustments, net | (3,166) | (1,209) | |||||||||||
| Amortization of (below) and above market leases/leasehold interests, net | 215 | (94) | |||||||||||
| Cash NOI | $ | 116,688 | $ | 84,024 | |||||||||
| Notes receivable interest income | (36) | (292) | |||||||||||
| Non Same-Property Cash NOI | (35,649) | (4,560) | |||||||||||
| Same-Property Cash NOI (1) | $ | 81,003 | $ | 79,172 | |||||||||
| Same-Property Cash NOI percentage growth | 2.3 | % | |||||||||||
| (1) Same-Property includes 342 buildings for the three months ended March 31, 2018 and 2017, respectively. | |||
NOI is a non-GAAP financial measure that is defined as net income or loss (computed in accordance with GAAP) before: (i) general and administrative expenses; (ii) transaction expenses; (iii) depreciation and amortization expense; (iv) impairment; (v) interest expense and net change in fair value of derivative financial instruments; (vi) gain or loss on sales of real estate; (vii) gain or loss on extinguishment of debt; (viii) income or loss from unconsolidated joint venture; and (ix) other income or expense. HTA believes that NOI provides an accurate measure of the operating performance of its operating assets because NOI excludes certain items that are not associated with the management of its properties. Additionally, HTA believes that NOI is a widely accepted measure of comparative operating performance of real estate investment trusts (“REITs”). However, HTA’s use of the term NOI may not be comparable to that of other REITs as they may have different methodologies for computing this amount. NOI should not be considered as an alternative to net income or loss (computed in accordance with GAAP) as an indicator of its financial performance. NOI should be reviewed in connection with other GAAP measurements.
Cash NOI is a non-GAAP financial measure which excludes from NOI: (i) straight-line rent adjustments; and (ii) amortization of below and above market leases/leasehold interests. Contractual base rent, contractual rent increases, contractual rent concessions and changes in occupancy or lease rates upon commencement and expiration of leases are a primary driver of HTA’s revenue performance. HTA believes that Cash NOI, which removes the impact of straight-line rent adjustments, provides another measurement of the operating performance of its operating assets. Additionally, HTA believes that Cash NOI is a widely accepted measure of comparative operating performance of REITs. However, HTA’s use of the term Cash NOI may not be comparable to that of other REITs as they may have different methodologies for computing this amount. Cash NOI should not be considered as an alternative to net income or loss (computed in accordance with GAAP) as an indicator of its financial performance. Cash NOI should be reviewed in connection with other GAAP measurements.
To facilitate the comparison of Cash NOI between periods, HTA calculates comparable amounts for a subset of its owned and operational properties referred to as “Same-Property”. Same-Property Cash NOI excludes properties which have not been owned and operated by HTA during the entire span of all periods presented, excluding properties intended for disposition in the near term, development and land parcels, HTA’s share of unconsolidated joint ventures, notes receivable interest income and certain non-routine items. Same-Property Cash NOI should not be considered as an alternative to net income or loss (computed in accordance with GAAP) as an indicator of its financial performance. Same-Property Cash NOI should be reviewed in connection with other GAAP measurements.
| HEALTHCARE TRUST OF AMERICA, INC. | |||||||
| FFO, NORMALIZED FFO AND NORMALIZED FAD | |||||||
| (In thousands, except per share data) | |||||||
| (Unaudited) | |||||||
| Three Months Ended March 31, | |||||||
| 2018 | 2017 | ||||||
| Net income attributable to common stockholders | $ | 9,802 | $ | 13,545 | |||
| Depreciation and amortization expense related to investments in real estate | 69,856 | 46,689 | |||||
| Gain on sale of real estate, net | — | (3) | |||||
| Impairment | 4,606 | — | |||||
| Proportionate share of joint venture depreciation and amortization | 351 | — | |||||
| FFO attributable to common stockholders | $ | 84,615 | $ | 60,231 | |||
| Transaction expenses | 191 | 284 | |||||
| Gain on change in fair value of derivative financial instruments, net | — | (839) | |||||
| Loss on extinguishment of debt, net | — | 32 | |||||
| Noncontrolling income from partnership units included in diluted shares | 181 | 425 | |||||
| Normalized FFO attributable to common stockholders | $ | 84,987 | $ | 60,133 | |||
| Other income | (35) | (8) | |||||
| Non-cash compensation expense | 3,479 | 2,530 | |||||
| Straight-line rent adjustments, net | (3,166) | (1,209) | |||||
| Amortization of (below) and above market leases/leasehold interests and corporate assets, net | 751 | 273 | |||||
| Deferred revenue – tenant improvement related | (31) | — | |||||
| Amortization of deferred financing costs and debt discount/premium, net | 1,289 | 786 | |||||
| Recurring capital expenditures, tenant improvements and leasing commissions | (11,350) | (9,640) | |||||
| Normalized FAD attributable to common stockholders | $ | 75,924 | $ | 52,865 | |||
| Net income attributable to common stockholders per diluted share | $ | 0.05 | $ | 0.09 | |||
| FFO adjustments per diluted share, net | 0.35 | 0.32 | |||||
| FFO attributable to common stockholders per diluted share | $ | 0.40 | $ | 0.41 | |||
| Normalized FFO adjustments per diluted share, net | 0.01 | 0.00 | |||||
| Normalized FFO attributable to common stockholders per diluted share | $ | 0.41 | $ | 0.41 | |||
| Weighted average diluted common shares outstanding | 209,177 | 146,117 | |||||
HTA computes FFO in accordance with the current standards established by NAREIT. NAREIT defines FFO as net income or loss attributable to common stockholders (computed in accordance with GAAP), excluding gains or losses from sales of real estate property and impairment write-downs of depreciable assets, plus depreciation and amortization related to investments in real estate, and after adjustments for unconsolidated partnerships and joint ventures. HTA presents this non-GAAP financial measure because it considers it an important supplemental measure of its operating performance and believes it is frequently used by securities analysts, investors and other interested parties in the evaluation of REITs. Historical cost accounting assumes that the value of real estate assets diminishes ratably over time. Since real estate values have historically risen or fallen based on market conditions, many industry investors have considered the presentation of operating results for real estate companies that use historical cost accounting to be insufficient by themselves. Because FFO excludes depreciation and amortization unique to real estate, among other items, it provides a perspective not immediately apparent from net income or loss attributable to common stockholders.
HTA computes Normalized FFO, which excludes from FFO: (i) transaction expenses; (ii) gain or loss on change in fair value of derivative financial instruments; (iii) gain or loss on extinguishment of debt; (iv) noncontrolling income or loss from partnership units included in diluted shares; and (v) other normalizing items, which include items that are unusual and infrequent in nature. HTA presents this non-GAAP financial measure because it allows for the comparison of its operating performance to other REITs and between periods on a consistent basis. HTA’s methodology for calculating Normalized FFO may be different from the methods utilized by other REITs and, accordingly, may not be comparable to other REITs. Normalized FFO should not be considered as an alternative to net income or loss attributable to common stockholders (computed in accordance with GAAP) as an indicator of its financial performance, nor is it indicative of cash available to fund cash needs. Normalized FFO should be reviewed in connection with other GAAP measurements.
HTA also computes Normalized FAD, which excludes from Normalized FFO: (i) other income or expense; (ii) non-cash compensation expense; (iii) straight-line rent adjustments; (iv) amortization of below and above market leases/leasehold interests and corporate assets; (v) amortization of deferred financing costs and debt premium/discount; and (vi) recurring capital expenditures, tenant improvements and leasing commissions. HTA believes this non-GAAP financial measure provides a meaningful supplemental measure of its operating performance. Normalized FAD should not be considered as an alternative to net income or loss attributable to common stockholders (computed in accordance with GAAP) as an indicator of its financial performance, nor is it indicative of cash available to fund cash needs. Normalized FAD should be reviewed in connection with other GAAP measurements.
The full content of this article is only available to paid subscribers. If you are an active subscriber, please log in. To subscribe, please click here: SUBSCRIBE