


Overreaction to demand led to LSRE oversupply, Revista webcast speaker says
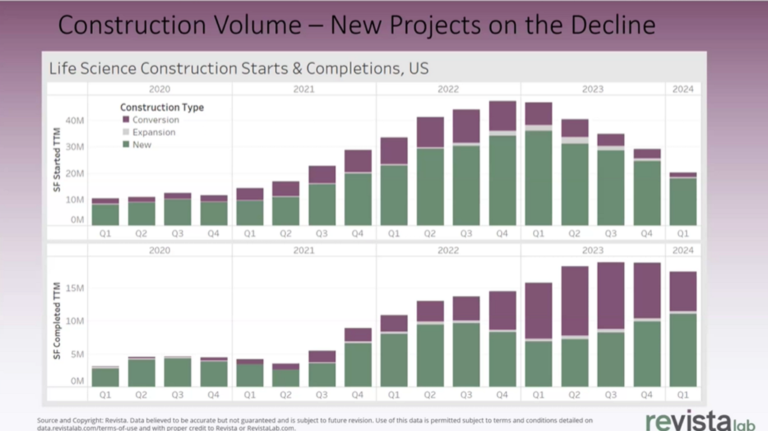
Construction starts have declined steadily during the past five quarters, according to RevistaLab data.
Chart courtesy of Revista
NATIONAL – It’s not often that bullwhips come up in daily conversation. Thankfully, the days of whipping animals and people are long past – hopefully. But the physics involved in cracking a whip can help explain the state of the life sciences real estate (LSRE) market.
Specifically, when a whip is “cracked,” a relatively slow snap of the wrist creates a wave that increases in velocity as it travels along the length of the whip. From a real estate standpoint, the “bullwhip effect” occurs when a relatively small variation in tenant demand reverberates up the supply chain, causing an overreaction by developers to satisfy that demand.
The LSRE business finds itself in that very situation, according to Alex Browne, Head of Life Science Research at Transwestern, who spoke during the recent RevistaLab Life Science Real Estate (LSRE) Market Update webcast. Rising demand by life sciences tenants in 2020 and 2021 resulted in an overreaction – and overbuilding – by LSRE developers in 2022 and 2023, Mr. Browne said.
Total inventory: 372 million square feet
The webcast also featured Hilda Martin, principal and co-founder of Revista, along with Revista Research Analyst Stephen Lindsey.
After brief introductions, Mr. Lindsey kicked things off by noting that the total LSRE inventory in the United States, as tracked by Revista, consists of about 372 million square feet.
“So, you know this sector is very cluster-driven, a lot of very big clusters,” he said, referring to a slide showing total inventory by geographic market. “These six largest clusters take up about 55 percent of the total square footage.
He noted that Revista’s data includes manufacturing facilities as well as research and development (R&D) space, along with user-owned buildings and corporate campuses.
“Then you can just look, you can see that the trend (of adding to inventory) has been going up,” Mr. Lindsey continued. “If you look from 2016 to maybe around 2020 area, it’s been rather gradual, and then starting in 2021, you can see the slope starts to steepen a little bit, and more and more supply was starting to come onto the market, especially with all the construction going on.” He added that the subsequent data would mostly focus on the three largest markets of Greater Boston, the San Francisco Bay Area and San Diego.
Mr. Martin noted, “You know, I think it’s so interesting how much inventory is outside of those three clusters, and even outside of this top six that you have here, Stephen. There’s just a significant amount of inventory beyond what we’re all constantly talking about with those core market areas.”
Mr. Lindsey noted that the mix of LSRE owners differs between the top three clusters and the rest of the market. In the top three clusters, private investors (41 percent) and real estate investment trusts (REITs, 36 percent) own about 77 percent of the real estate. But their share is only a combined 44 percent in the smaller markets, where life sciences companies are the biggest owners with 41 percent.
Users are the biggest owners in smaller markets
Mr. Lindsey noted that there is a big difference in the types of facilities located in the various markets. In the top three markets, 66 percent of the space is wet lab space, compared to 43 percent in the smaller markets. The smaller markets have 29 percent of the pure manufacturing space versus 6 percent in the big markets. Both markets consist of 28 percent combined wet lab and manufacturing space.
“So that may not come as too much of a surprise… (when) you think of all the downtown areas. There’s not going to be… a big pharmaceutical manufacturing facility,” Mr. Lindsay said. “But there is some out in the suburbs… So there still is a bit of it, just not nearly as much as in the more spread out markets across the U.S.”
Ms. Martin added that, in recent years, “there’s been a pretty meaningful uptick in the amount of (construction) projects that have manufacturing as a component… pretty much since the pandemic, with all those supply chain issues that arose and disruptions globally.”
Mr. Browne said onshoring and securing supply chains continues to be a trend.
“Also, there’s a lot of talk about nearshoring, if it’s not onshoring. Friendshoring (outsourcing from geopolitical allies), utilizing strategic partners like Mexico and Canada, would kind of be the next step of that,” he said.
Next, Mr. Lindsey shared the latest data on LSRE construction trends.
Notably, construction starts have declined steadily during the past five quarters, from more than 45 million square feet started on a trailing 12-month (TTM) basis at the end of the fourth quarter (Q4) of 2022 to about 20 million square feet through the end of Q1 2024.
Since Q4 2022, “Things have really been slowing down, been on a rather quick decline,” Mr. Lindsey said. “And… if you look on a quarterly basis, this first quarter has been much, much slower on a square foot basis.”
As for project completions, he said, “From 2023 until now, completions have been pretty consistent, anywhere from 15 to 20 million (square feet) coming onto the market on an annual basis, and we expect that to be strong going forward for a bit because all these projects that were entering the pipeline in 2022… they’re going to take a couple of years to make it to market.”
The conversion boom is over
He also noted that the boom in lab conversions during 2022 and early 2023 has ended.
“A much smaller percentage of the projects that are starting are conversions now,” he said. “And if you look at completions in 2023, a lot of conversions were being delivered, almost half of the new supply in some quarters were conversions. So that… has already started decreasing a little bit from a completion standpoint. But, going forward, it will probably be mainly new projects or new properties.”
“So new supply is really the big headline for life science, and it has been for a little while,” Ms. Martin said. With all the project starts in 2022 and 2023, she continued, “We’re currently seeing all of that beginning to open and come into the market. We’ve got another year or two of it.
“The starts this past quarter, though, the first quarter of ‘24, it’s a pretty significant drop. I mean, right around a million square feet started across the whole U.S. I mean, it’s really almost come to a halt.”
She then asked Mr. Browne of Transwestern how he expects those dynamics to play out.
“It’s great to look at this chart for the life science construction starts and completions, because it does emulate the phenomenon of a bullwhip,” he replied, “in that, like, if you turn on the tap, and then you turn off the tap, eventually once all that that product flows through the pipeline on the other end, you’re going to have a scarcity and then supply dynamics will have to readjust.
“So although there might be a kind of a glut of supply that does come online, ultimately the supply should equalize out as demand flips. So as we saw with demand flipping from landlords to tenants, now tenants have the upper hand. Once all that supply kind of works through and is a properly absorbed, then some of the dynamics will then radically shift back towards landlords because there is no new supply coming online.
“So, It’ll be interesting to see kind of how that bullwhip kind of will accentuate through, being that the tap is turned off even more. So I think we’re going to have an exponential flip on the other side.”
More supply equals lower occupancy rates
Mr. Lindsey then took a closer look at the supply due to come online.
“So, 78.8 million square feet (is) under construction right now,” he said, primarily in the larger markets, but with numerous smaller projects also taking place in secondary and emerging markets. Overall, supply is outpacing demand.
He noted that about 3 million to 6 million in new supply has been delivered every quarter for the past two years, “and that is just very strong.” Although absorption has also been “quite positive and quite strong… . it just hasn’t been quite at the volume of supply.”
As a result, the average occupancy rate “has been going down over this past two years,” he said, declining from about 95 percent in Q2 2022 to about 91.4 percent in Q1 2024.
Meanwhile, LRSE transaction volume “remains suppressed,” Mr. Lindsay said. On a TTM basis, LSRE transactions fell from nearly $19 billion through Q3 2022 to about $5.1 billion through Q1 2024.
“But, if you put it into context, we’re really just back down to pre-pandemic levels,” he pointed out, “and, considering that interest rates are much higher than they were back then – it’s tougher, it’s more pricey to secure capital – this is really not that surprising in terms of the volume we’re seeing, and there’s still some trades going on.”
Noting that “a lot” of new developers and investors entered the LSRE market in 2020 through 2022, Ms. Martin said, “You would think that there would be some pressure points now that could be an opportunity for investors in the sector. I mean, Alex, how are they viewing the sector? Do you think this is something that’s going to play out, some of the struggles that some of these new folks in particular, are having coming into life science?”
“Yeah, so I think from a transaction standpoint and an investor view, the largest headwind for that is interest rates still being elevated and kind of an unknown whether how long they’re going to stay elevated or when they’re going to start cutting – hopefully soon…,” Mr. Browne replied.
“However, the tenant mix in these buildings makes them uniquely diversified and allows them to be valued a little bit higher as compared to maybe some of the more distressed office properties as well. So I think that there is relative strength in the product type, but transaction value is going to be pretty suppressed due to the interest rates and our current environment.”
Mr. Browne noted that life sciences industry mergers and acquisitions (M&As) could strengthen the credit profiles of the buildings and campuses occupied by start-ups and small cap companies being acquired, which could result in a more favorable interest rate for potential real estate investor-borrowers.
Who’s still buying?
Mr. Lindsey then shared data about the mix of buyers that are still in the LSRE marketplace.
Health systems, governments and universities were the biggest buyers during the second half of 2023, in a market that had been dominated by private investors in 2022. REITs, which had been big buyers from 2019 through 2021, were net sellers through most of 2022 and 2023.
“And so, if you look at the first quarter of 2024, you can see everyone’s pretty neutral. No one doing a lot, a ton, of acquisitions, as we all know,” Mr. Lindsey said.
“If you look at health systems back in 2023, you can see towards the end, they’re actually quite positive, which is different than the norm of the past five years or so. There are a couple big transactions of some health systems and universities acquiring some big properties,” such as the June 2023 sale by Alexandria Real Estate Equities Inc. (NYSE: ARE) to Boston Children’s Hospital of 41 percent of the square footage in the 660,034 square foot 421 Park Drive development in Boston.
As for capitalization rates, Mr. Lindsey noted that they have fallen from a high of about 4.1 percent during Q1 2021 to about 5.9 percent during each of the past two quarters.
“So cap rates have definitely been expanding with less capital being deployed and less competition, you know, prices have become a little less competitive,” he said. “Whether we’ve kind of hit a leveling point in that 5.9 area or if it’ll continue to expand, it’s hard to tell and we’ll just have to wait and see.”
During that same period, average prices per square foot (PSF) have also increased, he noted. The increases have been most pronounced in the three largest markets, rising from $615 PSF in Q1 2020 to $832 PSF in Q1 2024 versus a rise from $243 to $254 in the rest of the nation. He added that some of the recent volatility in average prices PSF is due to the small number of transactions.
A webcast viewer asked for Revista’s opinion on whether all the projects in the pipeline – some of which are on hold – will actually deliver.
Ms. Martin replied, “Certainly, interest rates are also affecting new construction as well as transaction activity. We have a massive pipeline of planned projects, something like 200 million square feet across the U.S.,” that Revista is tracking.
“A lot of that stuff is definitely still sitting on hold, and we’ll see how that changes in the quarters to come,” he said.
Rents have softened, but rent bumps are rising
In terms of rental rates, Mr. Lindsey noted that average in-place rents for new leases in the top three markets peaked at $76.43 PSF during Q4 2022. Rents gradually softened to an average of $69.94 PSF by Q3 2023, but rose to $71.54 PSF on Q4 2024.
“So the new leases, especially as supply is increasing and maybe tenants now have a little more little more power, we’ve seen less of those really high prices on these new leases.
“Interestingly enough, though, if you look at the rent bumps, we’ve actually seen slightly higher in 2023.” He noted that median rent escalations in new leases rose to 3.3 percent during the last three quarters of 2023 versus 3 to 3.1 percent during the previous 36 months.
“So that’s likely because inflation has been a little stickier than everyone had hoped for and we’re starting to see some more of these leases having a 3.5 percent first-year rent bump, as opposed to the more standard 3 percent, which we saw in 2020 and 2021,” he said.
The full content of this article is only available to paid subscribers. If you are an active subscriber, please log in. To subscribe, please click here: SUBSCRIBE